LocationSouthwest, on the Río Negro and Río Uruguay
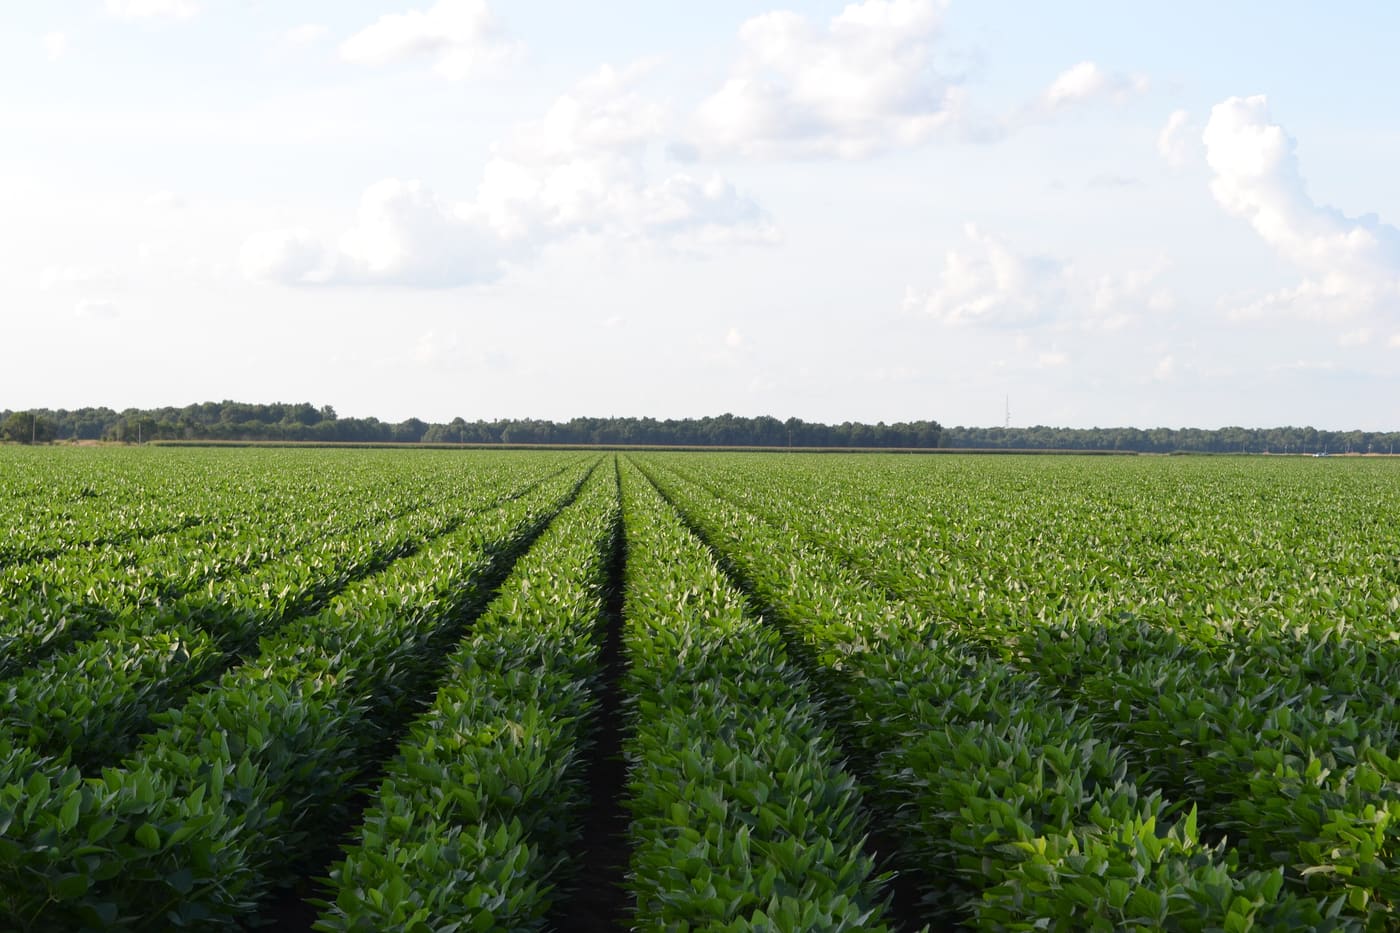
Land useCropping: soy, wheat, barley, maize
The price
The 2025 average was USD 7,964 per hectare, the second highest in the country after Colonia and roughly 91% above the national average.
The core cropping region
Together with Río Negro and Colonia, Soriano forms Uruguay's agricultural southwest. Deep soils, reliable rainfall distribution and a position on two navigable rivers make the region the centre of Uruguayan grain and oilseed production. Mercedes is the administrative hub.
For investors the relevant point is that the country's highest lease rates are achieved here. Official DIEA cropping lease figures for the first half of 2025 averaged USD 273 per hectare per year nationally, in core zones such as Soriano the range sits at the upper end.
Water as a value driver
River frontage and secured irrigation rights are reflected in price more strongly in Soriano than in any other department. Two parcels with identical CONEAT ratings can differ materially in value where one carries water rights and the other does not.
Information is provided for information purposes only and does not constitute investment, legal or tax advice. Prices shown are averages from official statistics, not valuations of individual properties.
The series for this department
Prices actually paid per hectare, area traded and the number of contracts of sale, year by year.
Since2000
Peak8,621 2024
Low445 2002
Soriano: Prices actually paid per hectare, area traded and the number of contracts of sale, year by year.
Year
USD/ha
Change
Hectares traded
Contracts
2000
611
14,753
84
2001
489
−20 %
35,954
138
2002
445
−9 %
24,987
98
2003
650
+46.1 %
53,425
188
2004
962
+48 %
65,737
245
2005
1,073
+11.5 %
50,576
198
2006
1,847
+72.1 %
52,826
184
2007
2,080
+12.6 %
32,290
189
2008
2,863
+37.6 %
19,968
135
2009
3,477
+21.4 %
14,972
80
2010
3,956
+13.8 %
16,677
109
2011
4,780
+20.8 %
18,368
112
2012
5,051
+5.7 %
16,280
99
2013
6,565
+30 %
18,119
104
2014
6,695
+2 %
9,173
69
2015
6,287
−6.1 %
8,012
77
2016
5,406
−14 %
4,004
43
2017
6,212
+14.9 %
10,454
64
2018
6,472
+4.2 %
7,936
47
2019
4,142
−36 %
16,031
53
2020
5,124
+23.7 %
7,455
48
2021
6,993
+36.5 %
14,078
71
2022
6,926
−1 %
15,454
89
2023
7,356
+6.2 %
8,624
60
2024
8,621
+17.2 %
7,309
63
2025
7,964
−7.6 %
7,565
66
Source: DIEA / MGAP, "Precio de la Tierra" series. Change against the previous year, computed from the same figures. Reconciled on 2026-07-27
The market report
Ten pages: what land costs in each of the 18 departments, what leasing yields, what a purchase adds on top, and the rules under which a foreigner may buy at all. Every figure with a source and a verification date.
Prices for all 18 departments, from registered contracts of sale
Gross yield from the official lease and price series, unvarnished
Transaction costs with rates, and what they come to on an average parcel
The ceilings in Canada and Argentina, with the statutes behind them
You receive the report immediately as a PDF. We also write when DIEA publishes new figures, normally twice a year. No advertising, never sold on, unsubscribe in every message.
Assess properties in this region
We benchmark every property against the most recently published comparable transactions in the same zone before any price is discussed.