Regions

Farmland in Tacuarembó

Tacuarembó is Uruguay's largest department by area and one of the cheapest ways to acquire land at meaningful scale.

Avg price 2025 2,720 USD/haTraded 2025 18,006 haLand use Extensive cattle, forestry
USD per hectare · DIEA 2025Spread, most to least expensive department 4.2×

Bar length and order follow the official annual figures. Percentage: change against 2024.
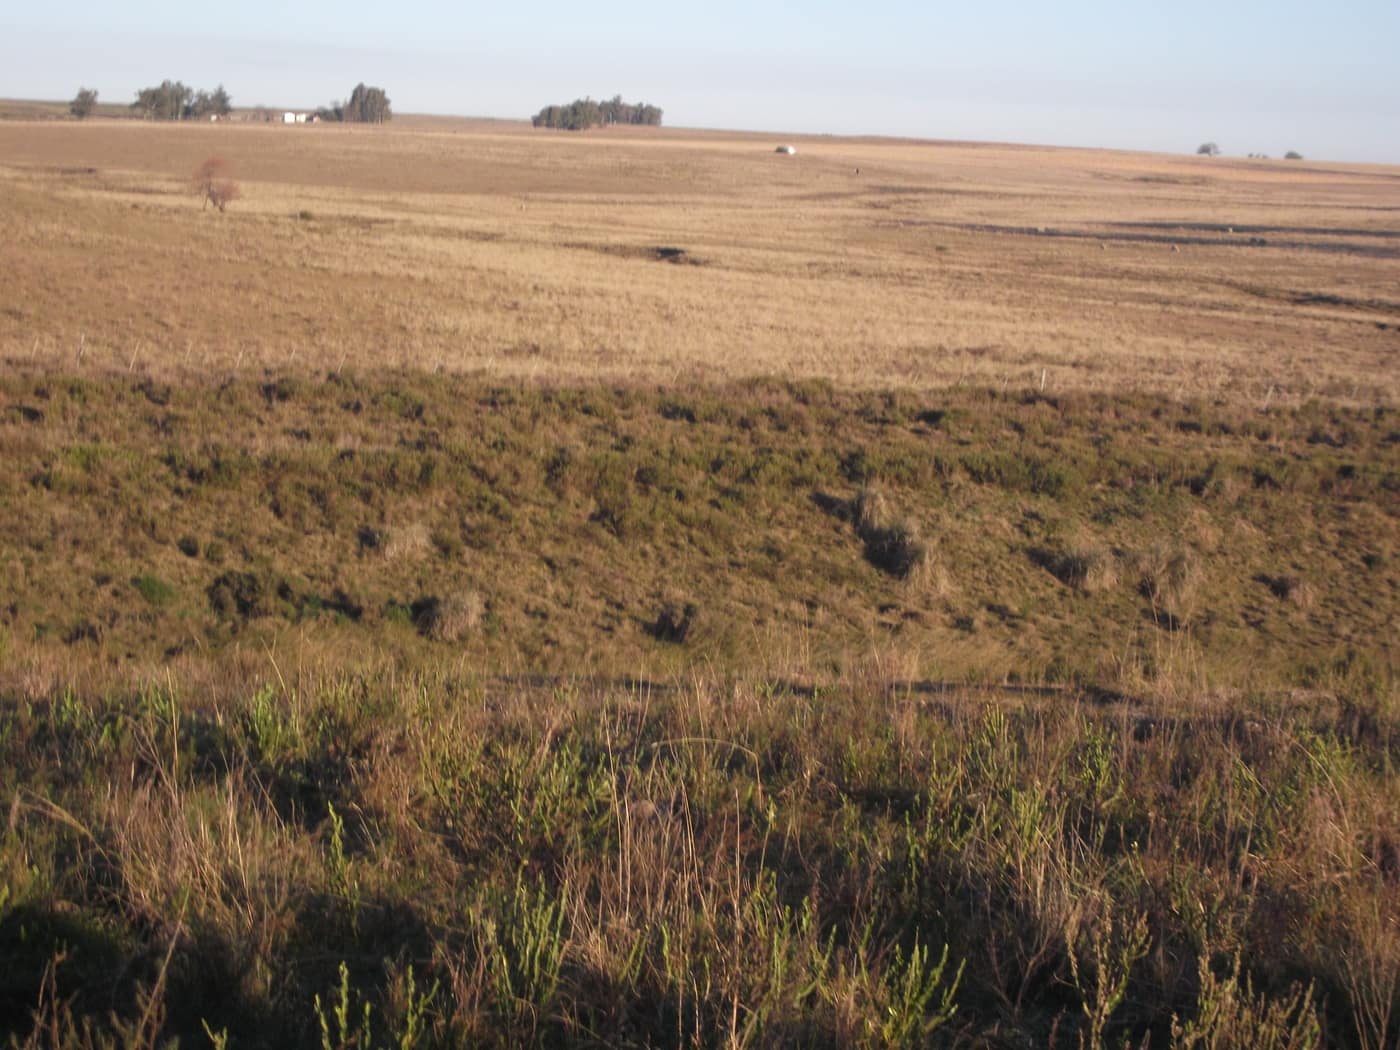
Harvested field to the horizon
Harvested field to the horizonGaap1 · CC BY-SA 3.0
Traded 202518,006ha
LocationNorth, centre to border region
Land useExtensive cattle, forestry

The price

Tacuarembó averaged USD 2,720 per hectare in 2025, down 10.7 % year on year and roughly 35 % below the national figure.

Capital efficiency, not soil rating

With 77 contracts across 18,006 hectares, the mean parcel is 234 hectares. The capital that buys about 100 hectares in Colonia buys over 350 here. That is the actual reason buyers look north.

What you give up is intensity. Soils over basalt and sandstone carry grazing and forestry, not intensive cropping. Output per hectare is lower and land is cheaper. Whether that trade works is decided by the operating plan, not by the price per hectare.

Distance as a cost line

The town of Tacuarembó is around 390 road kilometres from Montevideo. That affects freight to port and equally how often an owner based in Europe can realistically be on site. Both belong in the calculation before the low hectare price becomes convincing.

Sources

Figures verified on 2026-07-27

Information is provided for information purposes only and does not constitute investment, legal or tax advice. Prices shown are averages from official statistics, not valuations of individual properties.

The series for this department

Prices actually paid per hectare, area traded and the number of contracts of sale, year by year.

  • Since2000
  • Peak3,493 2018
  • Low303 2003
Tacuarembó: Prices actually paid per hectare, area traded and the number of contracts of sale, year by year.
YearUSD/haChangeHectares tradedContracts
200044023,903149
2001387−12 %43,405122
2002319−17.6 %51,343108
2003303−5 %60,342153
2004465+53.5 %69,194158
2005763+64.1 %95,558206
2006741−2.9 %72,218333
20071,301+75.6 %36,442155
20081,771+36.1 %87,669208
20091,617−8.7 %35,447144
20101,782+10.2 %17,58679
20112,322+30.3 %29,100116
20122,189−5.7 %23,732112
20133,269+49.3 %61,168105
20142,240−31.5 %7,08468
20152,687+20 %15,52362
20162,643−1.6 %11,97047
20172,836+7.3 %9,75147
20183,493+23.2 %16,01256
20192,873−17.7 %29,32353
20203,166+10.2 %25,78362
20212,326−26.5 %13,88558
20222,825+21.5 %17,82655
20233,095+9.6 %22,38768
20243,045−1.6 %59,42388
20252,720−10.7 %18,00677

Source: DIEA / MGAP, "Precio de la Tierra" series. Change against the previous year, computed from the same figures. Reconciled on 2026-07-27

The market report

Ten pages: what land costs in each of the 18 departments, what leasing yields, what a purchase adds on top, and the rules under which a foreigner may buy at all. Every figure with a source and a verification date.

  • Prices for all 18 departments, from registered contracts of sale
  • Gross yield from the official lease and price series, unvarnished
  • Transaction costs with rates, and what they come to on an average parcel
  • The ceilings in Canada and Argentina, with the statutes behind them

You receive the report immediately as a PDF. We also write when DIEA publishes new figures, normally twice a year. No advertising, never sold on, unsubscribe in every message.

Assess properties in this region

We benchmark every property against the most recently published comparable transactions in the same zone before any price is discussed.

Schedule a consultation

Other regions