Regions

Farmland in Rivera

No department shows more clearly how lumpy a land market becomes when a few large holders set the pace.

Avg price 2025 3,074 USD/haTraded 2025 7,676 haLand use Forestry, extensive cattle
USD per hectare · DIEA 2025Spread, most to least expensive department 4.2×

Bar length and order follow the official annual figures. Percentage: change against 2024.
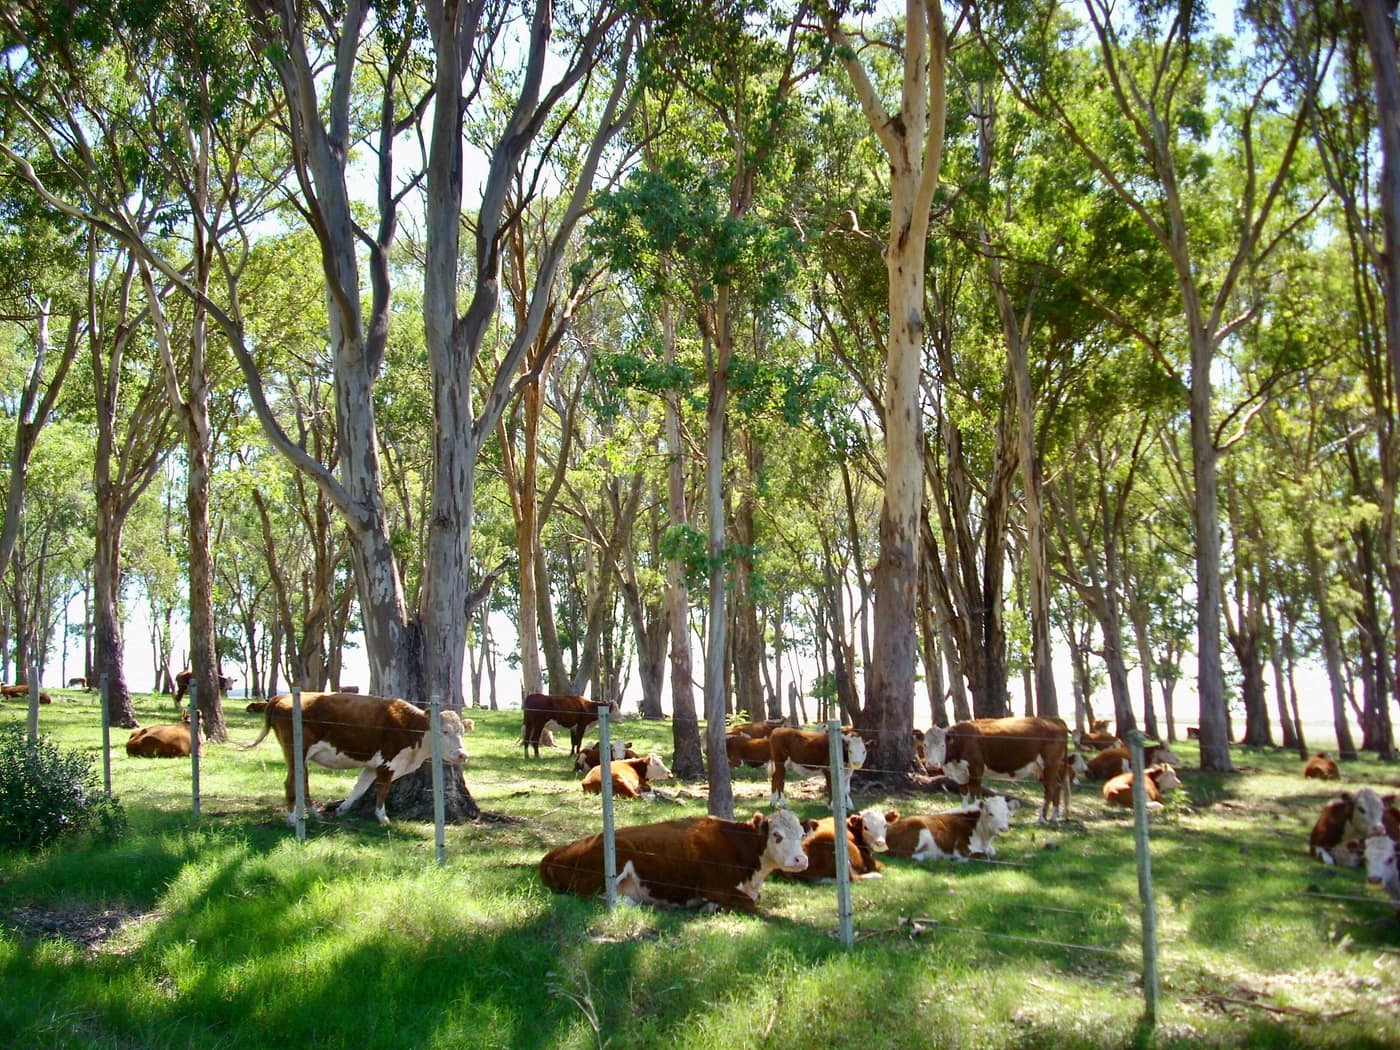
Cattle among eucalyptus
Cattle among eucalyptusWikimedia Commons · CC BY-SA 3.0
Traded 20257,676ha
LocationNorth, Brazilian border
Land useForestry, extensive cattle

The price

Rivera averaged USD 3,074 per hectare in 2025 against USD 3,435 the year before, a fall of 10.5 %.

From 55,251 to 7,676 hectares

In 2024 Rivera was by far Uruguay's most active department with 55,251 hectares traded. In 2025 the figure was 7,676 hectares, down 86 % in a single year.

That is not a collapse in demand. It is the signature of a market where forestry companies hold large contiguous blocks. When one such block sells, it dominates the annual statistic. When none does, the area falls back to whatever the rest of the market produces.

What follows from that

For valuation: a single department's annual figures are not a trend until you know which properties sit behind them. For buying: availability in Rivera depends heavily on whether an institutional holder happens to be selling.

Agronomically Rivera is forestry country. Sandy soils over sandstone carry eucalyptus and pine, with extensive cattle in between. Rivera forms a cross-border twin city with Santana do Livramento, where a street separates two states with no border installation.

Sources

Figures verified on 2026-07-27

Information is provided for information purposes only and does not constitute investment, legal or tax advice. Prices shown are averages from official statistics, not valuations of individual properties.

The series for this department

Prices actually paid per hectare, area traded and the number of contracts of sale, year by year.

  • Since2000
  • Peak3,435 2024
  • Low226 2002
Rivera: Prices actually paid per hectare, area traded and the number of contracts of sale, year by year.
YearUSD/haChangeHectares tradedContracts
200039914,88979
2001488+22.3 %26,04881
2002226−53.7 %18,15860
2003344+52.2 %26,75572
2004586+70.3 %18,56885
2005849+44.9 %39,753128
2006967+13.9 %30,317145
20071,123+16.1 %17,47381
20081,832+63.1 %65,962136
20091,660−9.4 %24,48674
20101,364−17.8 %9,98173
20112,705+98.3 %15,51097
20122,912+7.7 %17,13983
20133,000+3 %31,59585
20142,309−23 %22,50346
20152,071−10.3 %6,85172
20162,554+23.3 %3,85236
20172,177−14.8 %3,34335
20182,489+14.3 %12,43742
20192,615+5.1 %11,18338
20202,288−12.5 %6,47632
20212,434+6.4 %13,01156
20222,397−1.5 %18,81669
20232,763+15.3 %7,72457
20243,435+24.3 %55,25184
20253,074−10.5 %7,67667

Source: DIEA / MGAP, "Precio de la Tierra" series. Change against the previous year, computed from the same figures. Reconciled on 2026-07-27

The market report

Ten pages: what land costs in each of the 18 departments, what leasing yields, what a purchase adds on top, and the rules under which a foreigner may buy at all. Every figure with a source and a verification date.

  • Prices for all 18 departments, from registered contracts of sale
  • Gross yield from the official lease and price series, unvarnished
  • Transaction costs with rates, and what they come to on an average parcel
  • The ceilings in Canada and Argentina, with the statutes behind them

You receive the report immediately as a PDF. We also write when DIEA publishes new figures, normally twice a year. No advertising, never sold on, unsubscribe in every message.

Assess properties in this region

We benchmark every property against the most recently published comparable transactions in the same zone before any price is discussed.

Schedule a consultation

Other regions