Regions

Farmland in Salto

In Salto, the value of a property depends less on its soil rating than on whether water reaches it.

Avg price 2025 2,886 USD/haTraded 2025 7,166 haLand use Citrus, irrigated horticulture, cattle
USD per hectare · DIEA 2025Spread, most to least expensive department 4.2×

Bar length and order follow the official annual figures. Percentage: change against 2024.
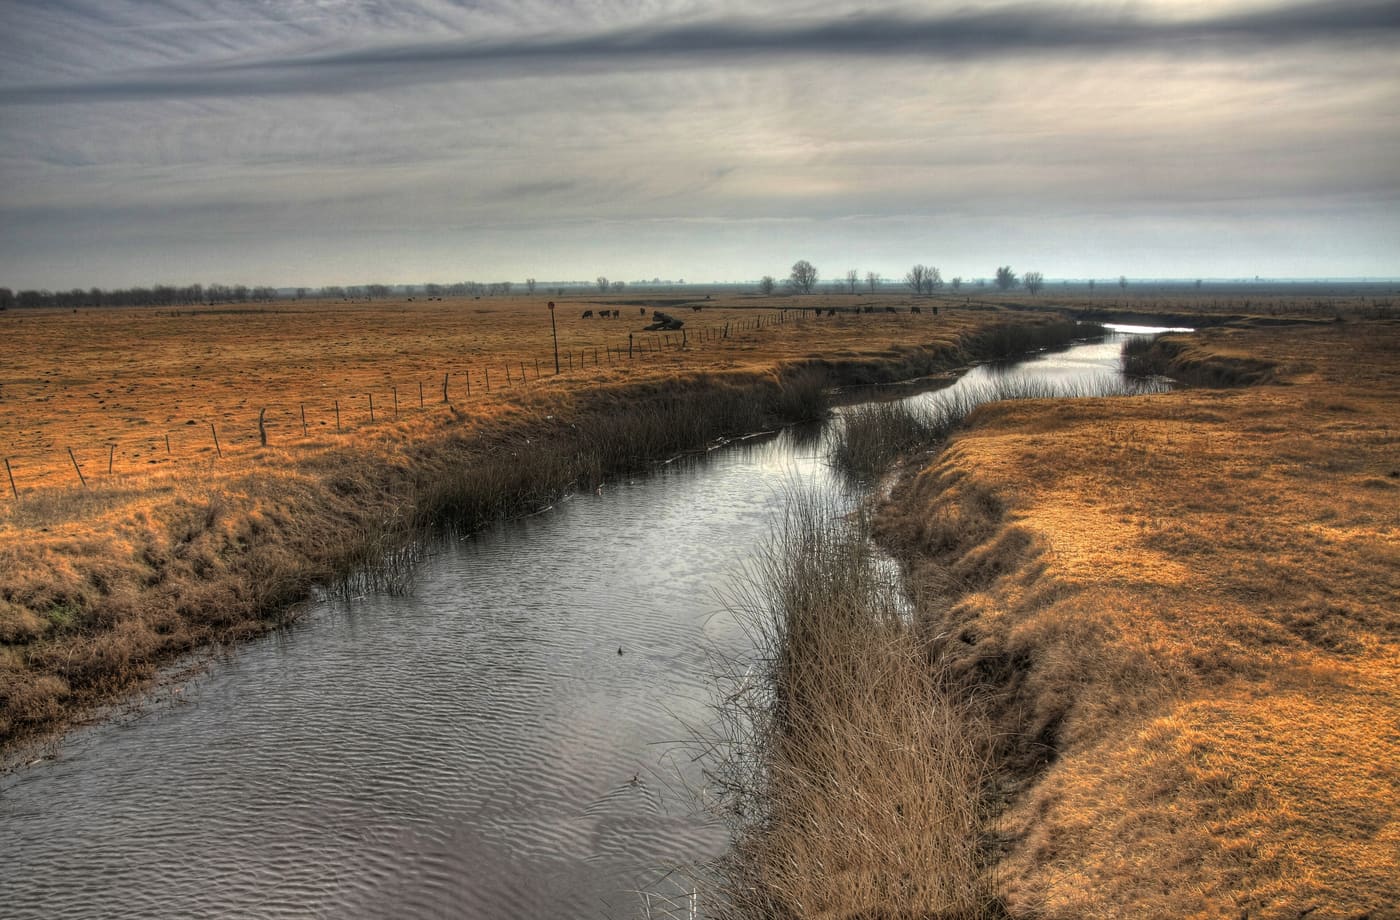
Irrigation channel, pampa
Irrigation channel, pampaLuis Argerich from Buenos Aires, Argentina · CC BY 2.0
Traded 20257,166ha
LocationNorthwest, on the Río Uruguay
Land useCitrus, irrigated horticulture, cattle

The price

Salto averaged USD 2,886 per hectare in 2025, up 4 % on 2024, placing it among the country's three cheapest departments.

Why the average says little here

Salto is Uruguay's citrus region and a centre of irrigated horticulture. At the same time a large share of its area sits on basalt soils grazed extensively. An irrigated citrus block and a basalt paddock are worlds apart, and both feed the same average.

Buying in Salto therefore means never arguing from the departmental average, but from what the specific property carries in water rights, irrigation infrastructure and soil class.

The water question

The Salto Grande reservoir and the Río Uruguay make irrigation practical in this part of the country. Irrigation systems and their permits are a diligence item in their own right: they are expensive, they are regulated, and they are why neighbouring parcels can be worth very different amounts.

A further regional factor are the hot springs around Daymán and Arapey, which give the department a tourism branch independent of agriculture.

Sources

Figures verified on 2026-07-27

Information is provided for information purposes only and does not constitute investment, legal or tax advice. Prices shown are averages from official statistics, not valuations of individual properties.

The series for this department

Prices actually paid per hectare, area traded and the number of contracts of sale, year by year.

  • Since2000
  • Peak6,124 2019
  • Low246 2001
Salto: Prices actually paid per hectare, area traded and the number of contracts of sale, year by year.
YearUSD/haChangeHectares tradedContracts
200044313,46052
2001246−44.5 %49,57497
2002257+4.5 %34,64375
2003266+3.5 %62,21996
2004385+44.7 %82,416157
2005485+26 %52,918120
20061,247+157.1 %42,442116
2007639−48.8 %42,446134
2008988+54.6 %41,431110
20091,300+31.6 %14,62676
20101,375+5.8 %17,63688
20111,907+38.7 %17,42376
20122,371+24.3 %19,72188
20132,385+0.6 %15,25683
20143,205+34.4 %10,88552
20151,715−46.5 %14,04554
20162,598+51.5 %11,00748
20171,979−23.8 %12,83360
20182,365+19.5 %4,75826
20196,124+158.9 %4,69333
20203,198−47.8 %3,43827
20212,268−29.1 %5,59933
20222,244−1.1 %19,11942
20233,415+52.2 %18,04871
20242,774−18.8 %13,84872
20252,886+4 %7,16653

Source: DIEA / MGAP, "Precio de la Tierra" series. Change against the previous year, computed from the same figures. Reconciled on 2026-07-27

The market report

Ten pages: what land costs in each of the 18 departments, what leasing yields, what a purchase adds on top, and the rules under which a foreigner may buy at all. Every figure with a source and a verification date.

  • Prices for all 18 departments, from registered contracts of sale
  • Gross yield from the official lease and price series, unvarnished
  • Transaction costs with rates, and what they come to on an average parcel
  • The ceilings in Canada and Argentina, with the statutes behind them

You receive the report immediately as a PDF. We also write when DIEA publishes new figures, normally twice a year. No advertising, never sold on, unsubscribe in every message.

Assess properties in this region

We benchmark every property against the most recently published comparable transactions in the same zone before any price is discussed.

Schedule a consultation

Other regions