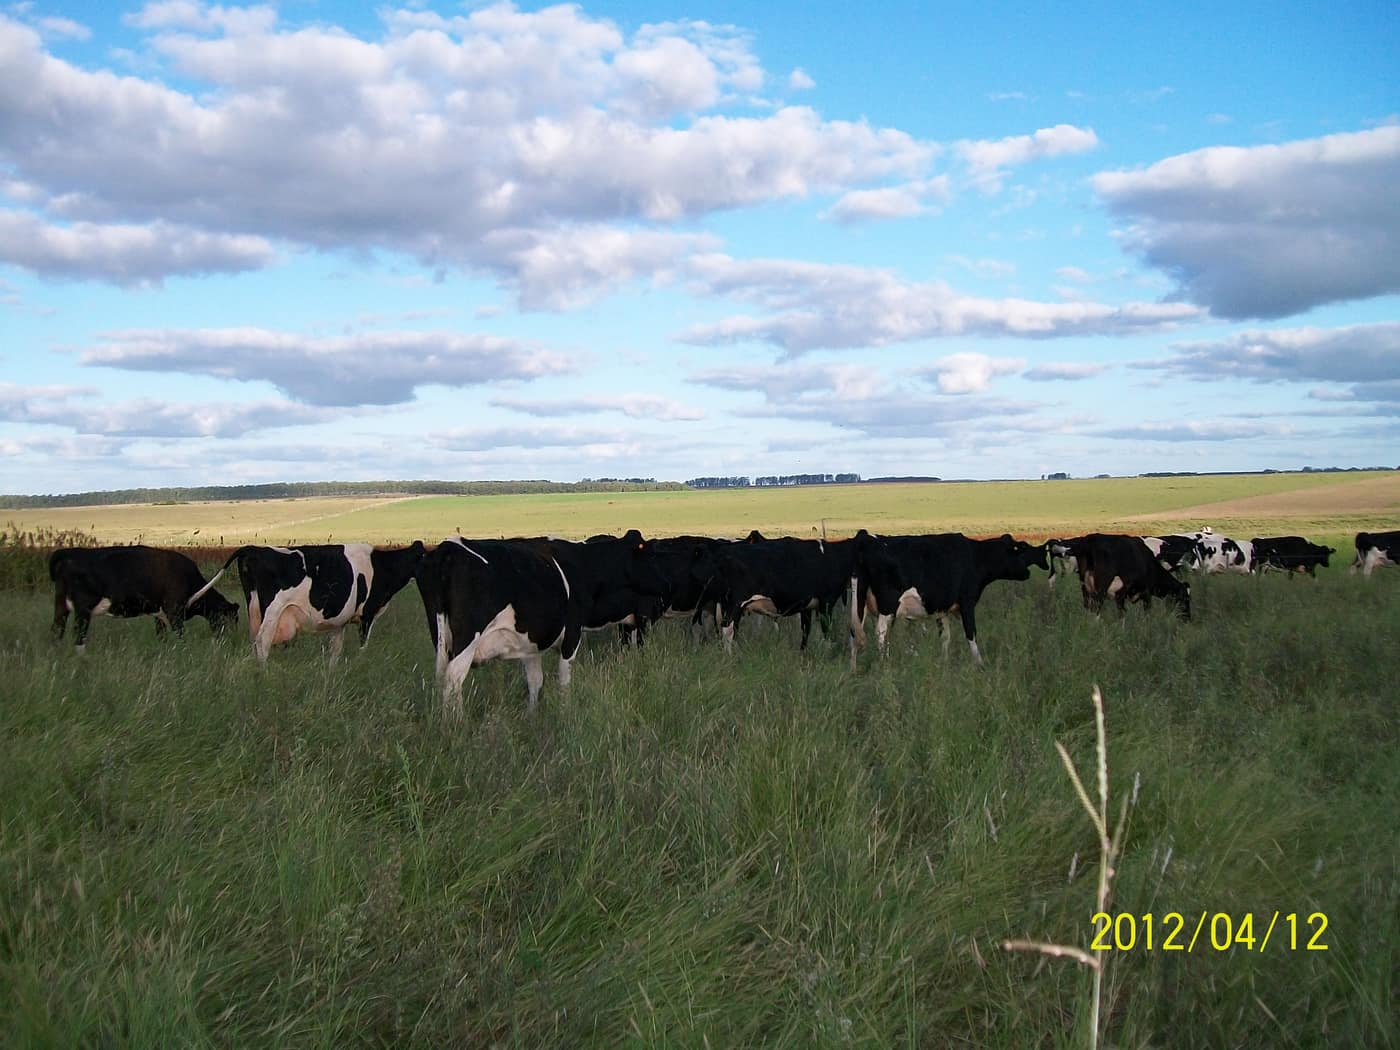
At USD 6,842 per hectare, San José was Uruguay's third most expensive department in 2025, after Colonia and Soriano.
The location premium
San José borders the department of Montevideo directly. That means short distances to the country's largest market, to the port and to Carrasco international airport. For operations handling perishables: dairy, vegetables, that proximity feeds straight into margin and is reflected in land value.
For non-resident owners the location carries a second, more practical advantage: farm visits can be combined with a stay in Montevideo without planning a domestic trip.
In context
San José is a compromise between the peak prices of the southwest and the area efficiency of the interior, with an accessibility premium that makes sense for some use profiles and not others.
Information is provided for information purposes only and does not constitute investment, legal or tax advice. Prices shown are averages from official statistics, not valuations of individual properties.
The series for this department
Prices actually paid per hectare, area traded and the number of contracts of sale, year by year.
Since2000
Peak6,842 2025
Low552 2003
San José: Prices actually paid per hectare, area traded and the number of contracts of sale, year by year.
Year
USD/ha
Change
Hectares traded
Contracts
2000
693
10,549
97
2001
665
−4 %
15,584
146
2002
634
−4.7 %
9,544
112
2003
552
−12.9 %
17,017
167
2004
740
+34.1 %
26,870
205
2005
754
+1.9 %
19,088
186
2006
1,212
+60.7 %
18,456
174
2007
1,849
+52.6 %
17,442
210
2008
2,474
+33.8 %
14,712
211
2009
3,037
+22.8 %
9,263
149
2010
5,110
+68.3 %
8,290
127
2011
5,422
+6.1 %
9,951
161
2012
6,165
+13.7 %
20,258
166
2013
5,974
−3.1 %
11,497
141
2014
6,667
+11.6 %
7,039
107
2015
4,870
−27 %
7,744
115
2016
4,787
−1.7 %
4,843
74
2017
6,165
+28.8 %
4,751
78
2018
5,451
−11.6 %
2,779
63
2019
3,941
−27.7 %
7,400
54
2020
5,850
+48.4 %
5,290
60
2021
5,209
−11 %
5,115
59
2022
5,002
−4 %
12,415
119
2023
5,564
+11.2 %
6,417
95
2024
6,507
+16.9 %
5,925
104
2025
6,842
+5.1 %
11,126
122
Source: DIEA / MGAP, "Precio de la Tierra" series. Change against the previous year, computed from the same figures. Reconciled on 2026-07-27
The market report
Ten pages: what land costs in each of the 18 departments, what leasing yields, what a purchase adds on top, and the rules under which a foreigner may buy at all. Every figure with a source and a verification date.
Prices for all 18 departments, from registered contracts of sale
Gross yield from the official lease and price series, unvarnished
Transaction costs with rates, and what they come to on an average parcel
The ceilings in Canada and Argentina, with the statutes behind them
You receive the report immediately as a PDF. We also write when DIEA publishes new figures, normally twice a year. No advertising, never sold on, unsubscribe in every message.
Assess properties in this region
We benchmark every property against the most recently published comparable transactions in the same zone before any price is discussed.