Regions

Farmland in Paysandú

Paysandú is Uruguay's most active farmland market, and materially cheaper than the national average. That combination is rare.

Avg price 2025 3,047 USD/haTraded 2025 31,999 haLand use Mixed: cropping, livestock, forestry
USD per hectare · DIEA 2025Spread, most to least expensive department 4.2×

Bar length and order follow the official annual figures. Percentage: change against 2024.
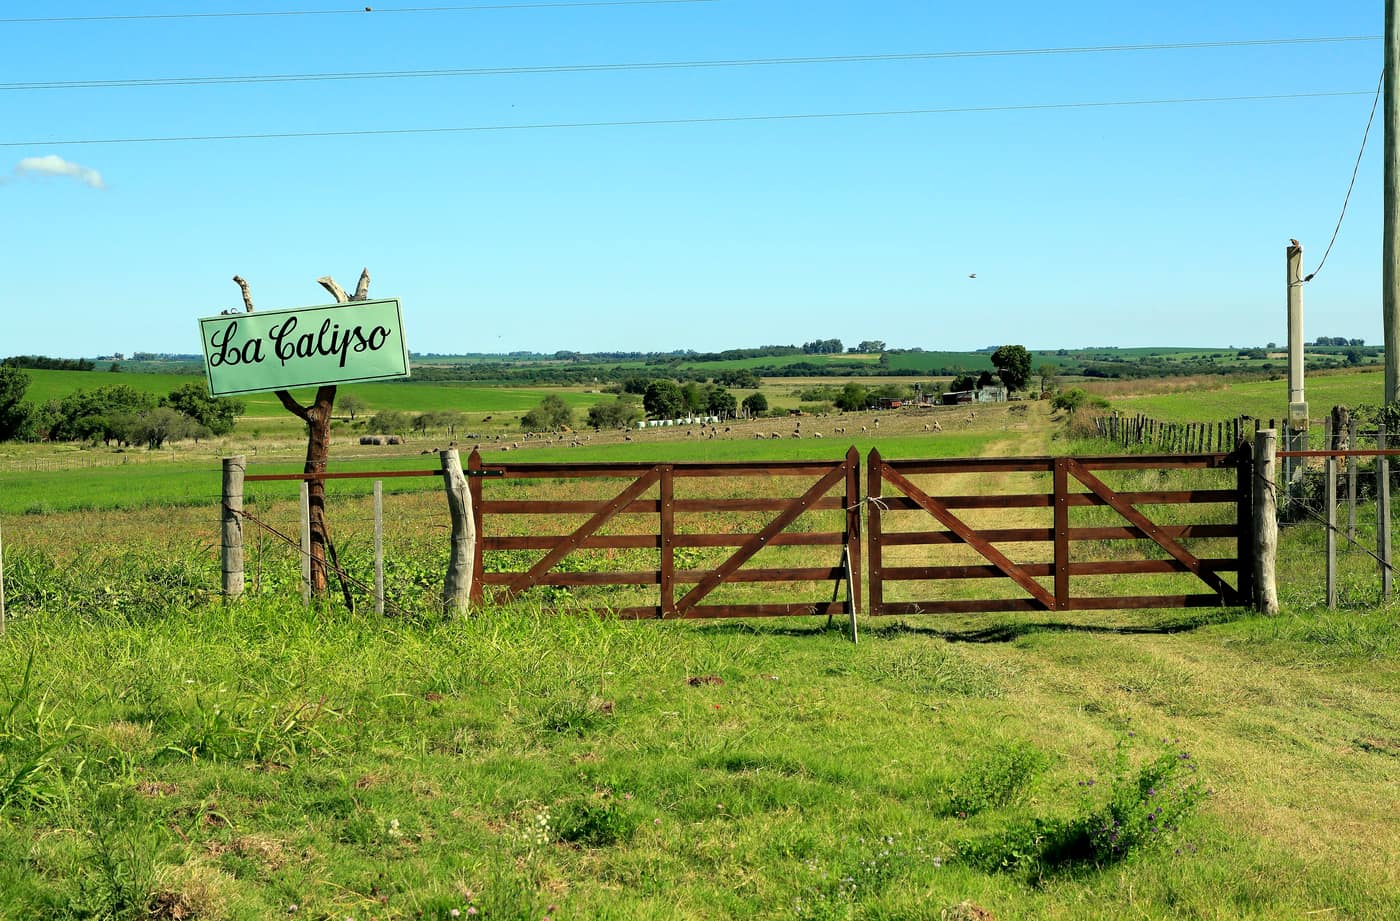
Gate to an estancia
Gate to an estanciaFalk2 · CC BY-SA 4.0
Traded 202531,999ha
LocationNorthwest, on the Río Uruguay
Land useMixed: cropping, livestock, forestry

Price and trading volume

The 2025 average was USD 3,047 per hectare: about 27 % below the national average of USD 4,178/ha and 17.6 % below its own 2024 level of USD 3,698/ha.

At the same time, with 31,999 hectares traded, Paysandú was by some distance the most active department of the year, ahead of Durazno (25,464 ha) and Treinta y Tres (23,994 ha).

Why that matters to a buyer

Trading volume is the practical definition of liquidity. A market where a lot of land changes hands each year offers two things: continuous deal flow, so you are not forced to take the first property you see, and robust comparables for your own valuation.

The lower price per hectare reflects more extensive use and more heterogeneous soil quality than the southwest. The range within the department is correspondingly wide: the average is less useful as orientation here than elsewhere, and CONEAT verification of the specific parcels carries all the more weight.

Who Paysandú suits

  • Investors prioritising area and scale over premium soil
  • Mixed farming and livestock with upside through pasture improvement
  • Buyers who value choice and comparability

Sources

Figures verified on 2026-07-27

Information is provided for information purposes only and does not constitute investment, legal or tax advice. Prices shown are averages from official statistics, not valuations of individual properties.

The series for this department

Prices actually paid per hectare, area traded and the number of contracts of sale, year by year.

  • Since2000
  • Peak4,350 2017
  • Low349 2002
Paysandú: Prices actually paid per hectare, area traded and the number of contracts of sale, year by year.
YearUSD/haChangeHectares tradedContracts
200044123,10080
2001519+17.7 %32,61397
2002349−32.8 %24,37858
2003351+0.6 %112,794121
2004611+74.1 %76,467173
2005695+13.7 %101,827215
20061,246+79.3 %117,556235
20071,471+18.1 %41,128143
20081,649+12.1 %58,390107
20092,206+33.8 %43,91968
20102,093−5.1 %21,82286
20113,249+55.2 %33,71578
20123,021−7 %39,67662
20133,238+7.2 %15,63459
20143,749+15.8 %7,74037
20152,978−20.6 %8,90439
20164,279+43.7 %12,81330
20174,350+1.7 %17,76540
20182,173−50 %6,36130
20193,813+75.5 %14,62845
20203,439−9.8 %14,49936
20213,224−6.3 %15,91447
20223,580+11 %20,40667
20234,228+18.1 %12,92655
20243,698−12.5 %21,48463
20253,047−17.6 %31,99975

Source: DIEA / MGAP, "Precio de la Tierra" series. Change against the previous year, computed from the same figures. Reconciled on 2026-07-27

The market report

Ten pages: what land costs in each of the 18 departments, what leasing yields, what a purchase adds on top, and the rules under which a foreigner may buy at all. Every figure with a source and a verification date.

  • Prices for all 18 departments, from registered contracts of sale
  • Gross yield from the official lease and price series, unvarnished
  • Transaction costs with rates, and what they come to on an average parcel
  • The ceilings in Canada and Argentina, with the statutes behind them

You receive the report immediately as a PDF. We also write when DIEA publishes new figures, normally twice a year. No advertising, never sold on, unsubscribe in every message.

Assess properties in this region

We benchmark every property against the most recently published comparable transactions in the same zone before any price is discussed.

Schedule a consultation

Other regions