Regions

Land in Maldonado

Maldonado is the one department where the price of land is set mainly by something other than what grows on it.

Avg price 2025 5,647 USD/haTraded 2025 5,895 haLand use Chacras, grazing, residential use, viticulture
USD per hectare · DIEA 2025Spread, most to least expensive department 4.2×

Bar length and order follow the official annual figures. Percentage: change against 2024.
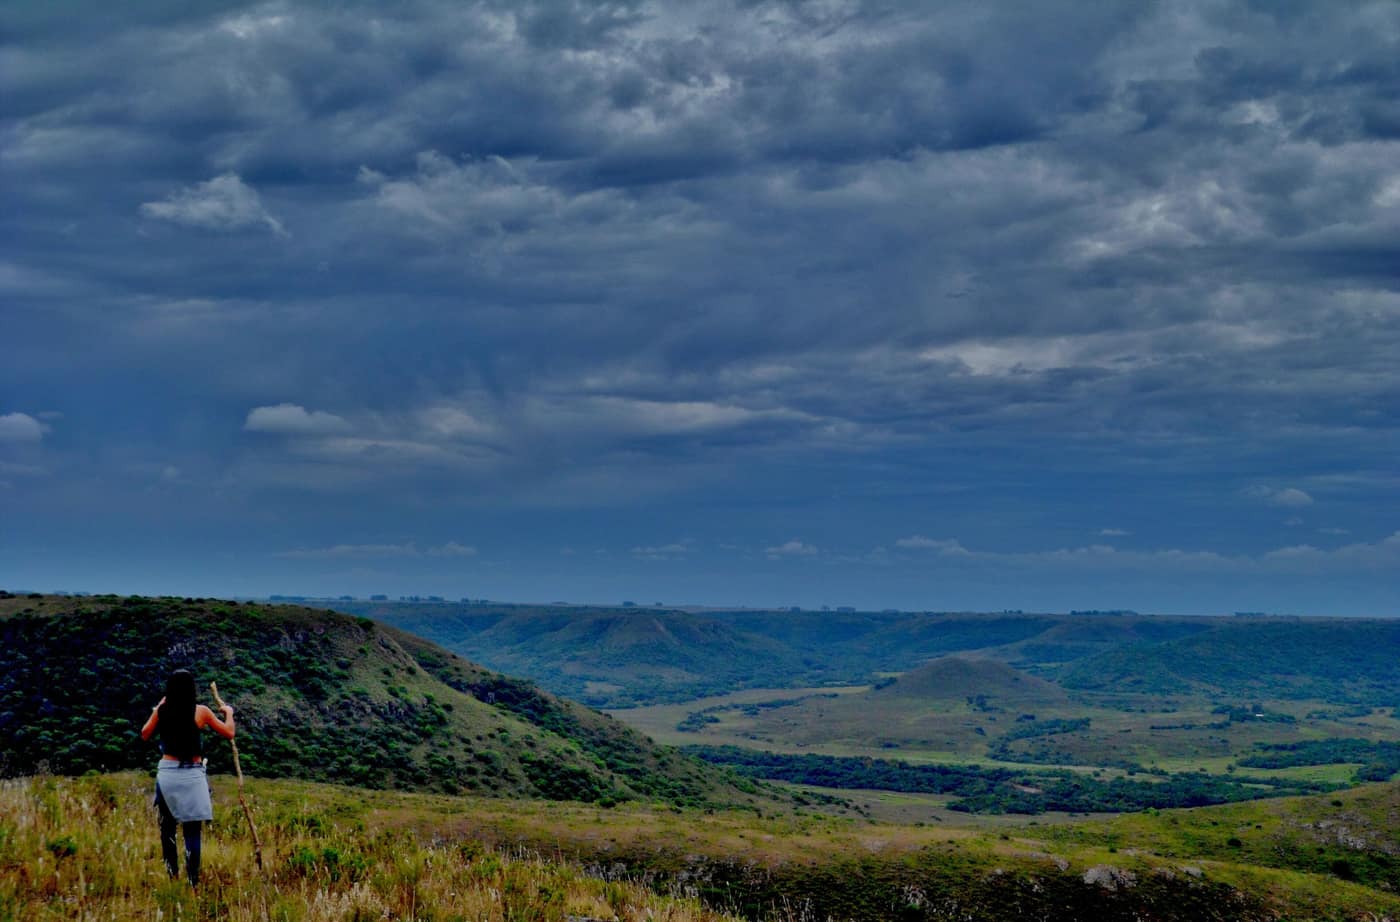
View across the sierras
View across the sierrasAnalía Mosqueira · CC BY-SA 3.0
Traded 20255,895ha
LocationSoutheast coast, Punta del Este
Land useChacras, grazing, residential use, viticulture

The price

The 2025 average was USD 5,647 per hectare, essentially flat on 2024. That is about a third above the national figure, and for a department of mostly light soils and sierra terrain it cannot be justified agronomically.

Why price forms differently here

Maldonado contains Punta del Este. Much of the demand for land comes from buyers who intend to live, not produce: chacras in the hinterland of José Ignacio, plots towards Pueblo Garzón, land with a sea view or close to the coast.

That is not a criticism but a distinction you need before buying. A hectare in Maldonado and a hectare in Soriano cost roughly the same and produce entirely different things. Underwriting this on operating yield means underwriting against the market.

Who Maldonado suits

  • Buyers whose primary purpose is residence or a residency option, with land attached
  • Uses that capitalise landscape: vineyards, olives, guest operations
  • Anyone who needs Laguna del Sauce international airport nearby

What it does not suit: a pure income holding. The price per productive hectare is too high, and the competition for land comes off a different demand curve.

Sources

Figures verified on 2026-07-27

Information is provided for information purposes only and does not constitute investment, legal or tax advice. Prices shown are averages from official statistics, not valuations of individual properties.

The series for this department

Prices actually paid per hectare, area traded and the number of contracts of sale, year by year.

  • Since2006
  • Peak5,764 2024
  • Low2,051 2008
Maldonado: Prices actually paid per hectare, area traded and the number of contracts of sale, year by year.
YearUSD/haChangeHectares tradedContracts
20062,76710,957145
20072,811+1.6 %21,293267
20082,051−27 %19,587245
20093,408+66.2 %8,776178
20104,087+19.9 %7,544153
20113,955−3.2 %17,021193
20124,536+14.7 %8,331149
20134,730+4.3 %15,495143
20144,671−1.2 %4,981101
20154,064−13 %6,34094
20163,310−18.6 %2,43356
20174,545+37.3 %5,46795
20184,173−8.2 %4,43266
20192,566−38.5 %7,30766
20202,927+14.1 %6,25260
20214,067+38.9 %9,730100
20223,888−4.4 %5,12382
20234,340+11.6 %11,01465
20245,764+32.8 %6,609120
20255,647−2 %5,895108

Source: DIEA / MGAP, "Precio de la Tierra" series. Change against the previous year, computed from the same figures. Reconciled on 2026-07-27

The market report

Ten pages: what land costs in each of the 18 departments, what leasing yields, what a purchase adds on top, and the rules under which a foreigner may buy at all. Every figure with a source and a verification date.

  • Prices for all 18 departments, from registered contracts of sale
  • Gross yield from the official lease and price series, unvarnished
  • Transaction costs with rates, and what they come to on an average parcel
  • The ceilings in Canada and Argentina, with the statutes behind them

You receive the report immediately as a PDF. We also write when DIEA publishes new figures, normally twice a year. No advertising, never sold on, unsubscribe in every message.

Assess properties in this region

We benchmark every property against the most recently published comparable transactions in the same zone before any price is discussed.

Schedule a consultation

Other regions