Regions

Farmland in Flores

Flores is the smallest inland department and the thinnest market in Uruguay. The two go together, and both matter before you buy.

Avg price 2025 4,667 USD/haTraded 2025 3,747 haLand use Mixed farming, cropping, cattle and sheep
USD per hectare · DIEA 2025Spread, most to least expensive department 4.2×

Bar length and order follow the official annual figures. Percentage: change against 2024.
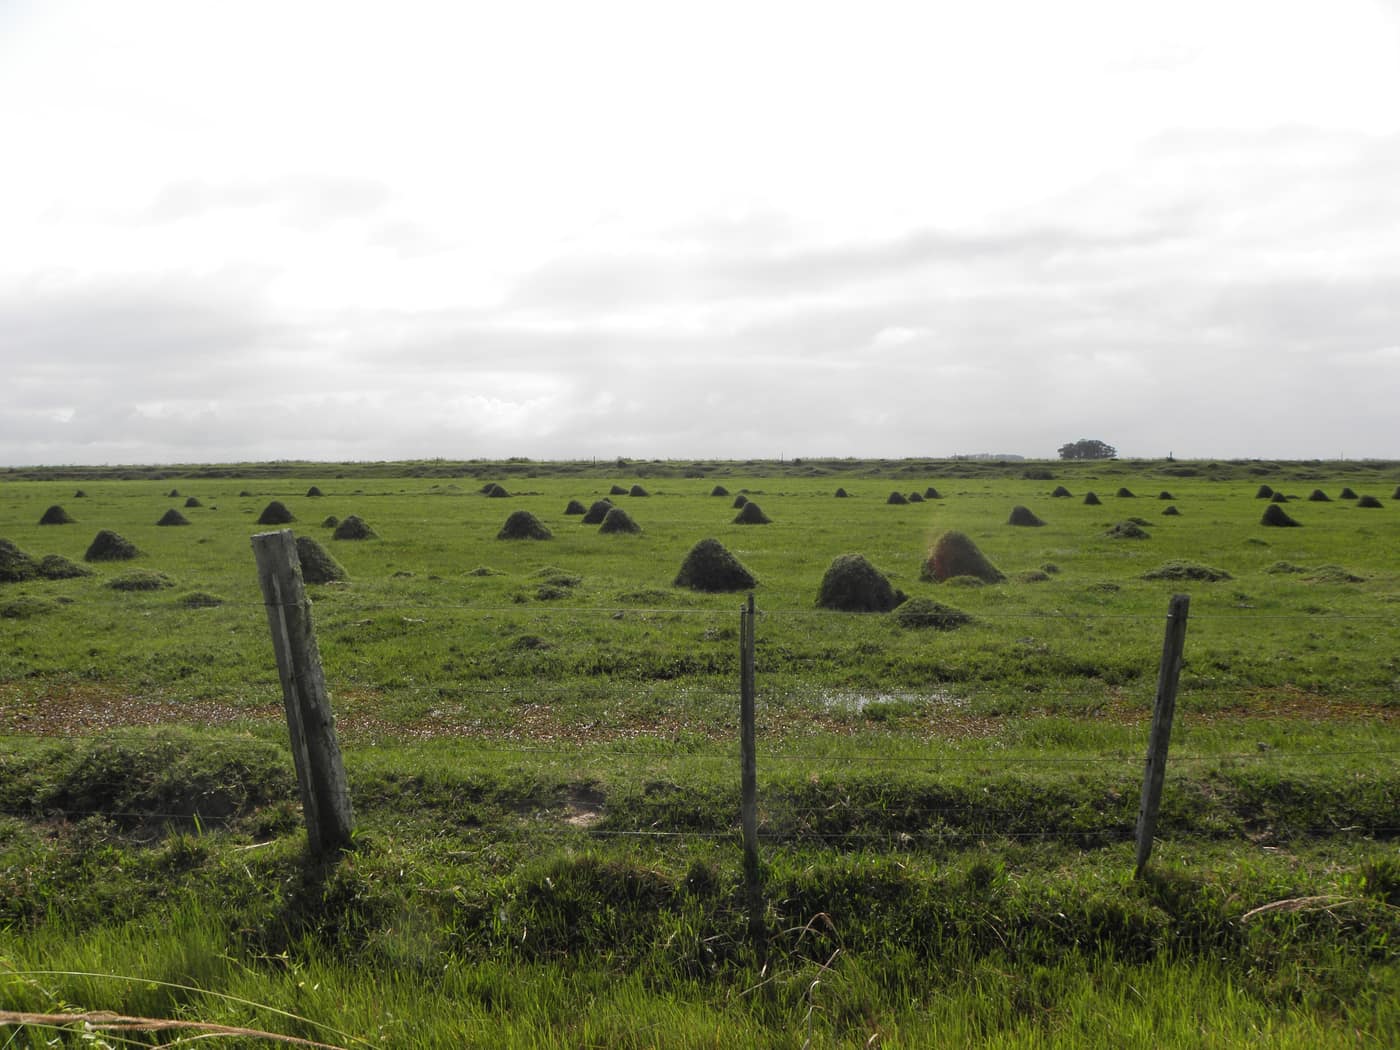
Fence line across grassland
Fence line across grasslandJulio J. · CC BY-SA 4.0
Traded 20253,747ha
LocationSouth-central, around Trinidad
Land useMixed farming, cropping, cattle and sheep

The price

Flores averaged USD 4,667 per hectare in 2025, down 11.7 % on 2024, leaving it slightly above the national figure.

Just 32 contracts in the year

Across all of 2025, Flores registered 32 purchase contracts covering 3,747 hectares. That is the lowest transaction volume of any department. Canelones, for comparison, recorded 175.

That number matters more than it looks. An average drawn from 32 cases is sensitive to a single large or unusual sale. The 11.7 % fall therefore does not necessarily mean land in Flores got cheaper. It may equally mean different properties traded this year.

How to buy in a thin market

The departmental average works here as rough orientation, not as a valuation benchmark. Valuation only becomes reliable through CONEAT soil ratings and through comparables from the neighbouring departments of Florida, Durazno and San José, whose markets are deeper.

Sources

Figures verified on 2026-07-27

Information is provided for information purposes only and does not constitute investment, legal or tax advice. Prices shown are averages from official statistics, not valuations of individual properties.

The series for this department

Prices actually paid per hectare, area traded and the number of contracts of sale, year by year.

  • Since2000
  • Peak5,693 2022
  • Low413 2001
Flores: Prices actually paid per hectare, area traded and the number of contracts of sale, year by year.
YearUSD/haChangeHectares tradedContracts
200061012,34752
2001413−32.3 %21,18171
2002485+17.4 %16,76069
2003471−2.9 %34,34578
2004602+27.8 %31,40594
2005964+60.1 %19,15187
20061,379+43 %23,82277
20071,773+28.6 %19,39780
20082,505+41.3 %11,15752
20093,256+30 %7,72830
20104,210+29.3 %15,22152
20113,163−24.9 %5,68142
20125,389+70.4 %8,30340
20134,894−9.2 %7,80541
20144,972+1.6 %6,17731
20154,646−6.6 %10,71926
20163,045−34.5 %3,21918
20174,843+59 %4,62928
20183,078−36.4 %4,04623
20193,777+22.7 %12,14617
20204,104+8.7 %9,24532
20214,300+4.8 %12,27740
20225,693+32.4 %6,89935
20234,571−19.7 %6,07344
20245,287+15.7 %8,31632
20254,667−11.7 %3,74732

Source: DIEA / MGAP, "Precio de la Tierra" series. Change against the previous year, computed from the same figures. Reconciled on 2026-07-27

The market report

Ten pages: what land costs in each of the 18 departments, what leasing yields, what a purchase adds on top, and the rules under which a foreigner may buy at all. Every figure with a source and a verification date.

  • Prices for all 18 departments, from registered contracts of sale
  • Gross yield from the official lease and price series, unvarnished
  • Transaction costs with rates, and what they come to on an average parcel
  • The ceilings in Canada and Argentina, with the statutes behind them

You receive the report immediately as a PDF. We also write when DIEA publishes new figures, normally twice a year. No advertising, never sold on, unsubscribe in every message.

Assess properties in this region

We benchmark every property against the most recently published comparable transactions in the same zone before any price is discussed.

Schedule a consultation

Other regions