Regions

Farmland in Treinta y Tres

Eastern Uruguay follows its own logic: here water determines value, not the soil index alone.

Avg price 2025 3,384 USD/haTraded 2025 23,994 haLand use Rice, livestock, forestry
USD per hectare · DIEA 2025Spread, most to least expensive department 4.2×

Bar length and order follow the official annual figures. Percentage: change against 2024.
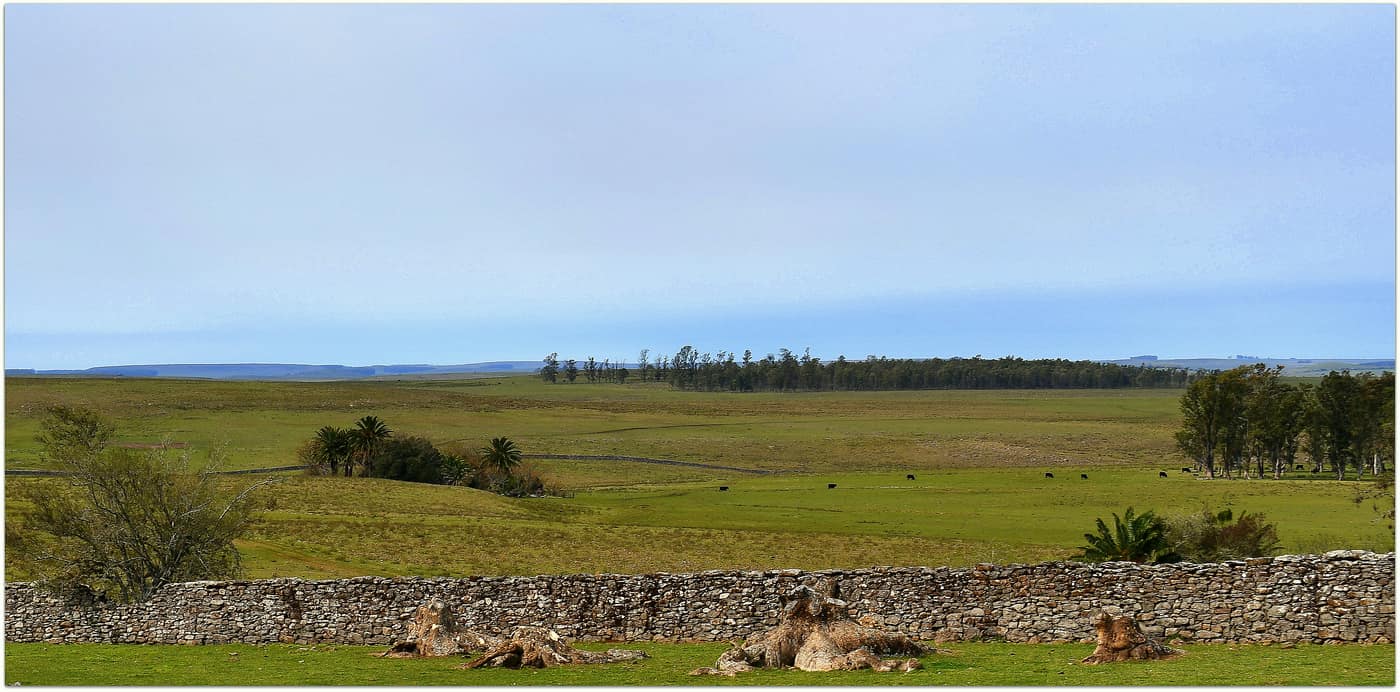
Dry stone wall and grazing land
Dry stone wall and grazing landAlfi1781 · CC BY-SA 4.0
Traded 202523,994ha
LocationEast, toward Laguna Merín
Land useRice, livestock, forestry

Trading volume

With 23,994 hectares traded, Treinta y Tres ranked third among Uruguay's most active departments in 2025.

The 2025 average was USD 3,384 per hectare, up 6.9 % from USD 3,166 the year before. Across 82 contracts the mean parcel works out at 293 hectares, close to double the national figure.

Rice and water

Eastern Uruguay is the centre of the country's rice production. Rice is the most water-intensive crop grown here, and valuation works accordingly: access to surface water, existing irrigation infrastructure, reservoirs and water rights determine a parcel's value more than the CONEAT index alone.

For buyers this means the standard assessment logic must be extended. A rice parcel without secured water supply is not the same asset as one with a reservoir, even where soil class and hectare count look identical.

Rotation with livestock

Rotating rice with grazing is characteristic of the region. The combination spreads price risk across two markets and is agronomically established. For investors who do not want exposure to a single crop, that is a structural advantage over pure soy.

Sources

Figures verified on 2026-07-27

Information is provided for information purposes only and does not constitute investment, legal or tax advice. Prices shown are averages from official statistics, not valuations of individual properties.

The series for this department

Prices actually paid per hectare, area traded and the number of contracts of sale, year by year.

  • Since2000
  • Peak3,384 2025
  • Low261 2002
Treinta y Tres: Prices actually paid per hectare, area traded and the number of contracts of sale, year by year.
YearUSD/haChangeHectares tradedContracts
200030713,71847
2001305−0.7 %23,03092
2002261−14.4 %23,27777
2003317+21.5 %56,00776
2004400+26.2 %27,565107
2005370−7.5 %27,414133
2006813+119.7 %57,824127
20071,079+32.7 %45,827171
20081,368+26.8 %43,528112
20091,538+12.4 %6,35660
20101,656+7.7 %10,82866
20111,994+20.4 %26,439130
20122,406+20.7 %23,148106
20132,591+7.7 %23,81769
20142,354−9.1 %5,68234
20152,916+23.9 %10,34558
20162,146−26.4 %6,45642
20173,047+42 %14,61656
20182,761−9.4 %10,42245
20192,700−2.2 %20,97039
20202,249−16.7 %4,34338
20212,569+14.2 %16,16157
20222,520−1.9 %13,36089
20232,564+1.7 %15,95986
20243,166+23.5 %41,72785
20253,384+6.9 %23,99482

Source: DIEA / MGAP, "Precio de la Tierra" series. Change against the previous year, computed from the same figures. Reconciled on 2026-07-27

The market report

Ten pages: what land costs in each of the 18 departments, what leasing yields, what a purchase adds on top, and the rules under which a foreigner may buy at all. Every figure with a source and a verification date.

  • Prices for all 18 departments, from registered contracts of sale
  • Gross yield from the official lease and price series, unvarnished
  • Transaction costs with rates, and what they come to on an average parcel
  • The ceilings in Canada and Argentina, with the statutes behind them

You receive the report immediately as a PDF. We also write when DIEA publishes new figures, normally twice a year. No advertising, never sold on, unsubscribe in every message.

Assess properties in this region

We benchmark every property against the most recently published comparable transactions in the same zone before any price is discussed.

Schedule a consultation

Other regions