Regions

Farmland in Río Negro

Río Negro is the large-block market. Few properties change hands here, but each one is substantial.

Avg price 2025 5,138 USD/haTraded 2025 18,180 haLand use Industrial-scale cropping, forestry, cattle
USD per hectare · DIEA 2025Spread, most to least expensive department 4.2×

Bar length and order follow the official annual figures. Percentage: change against 2024.
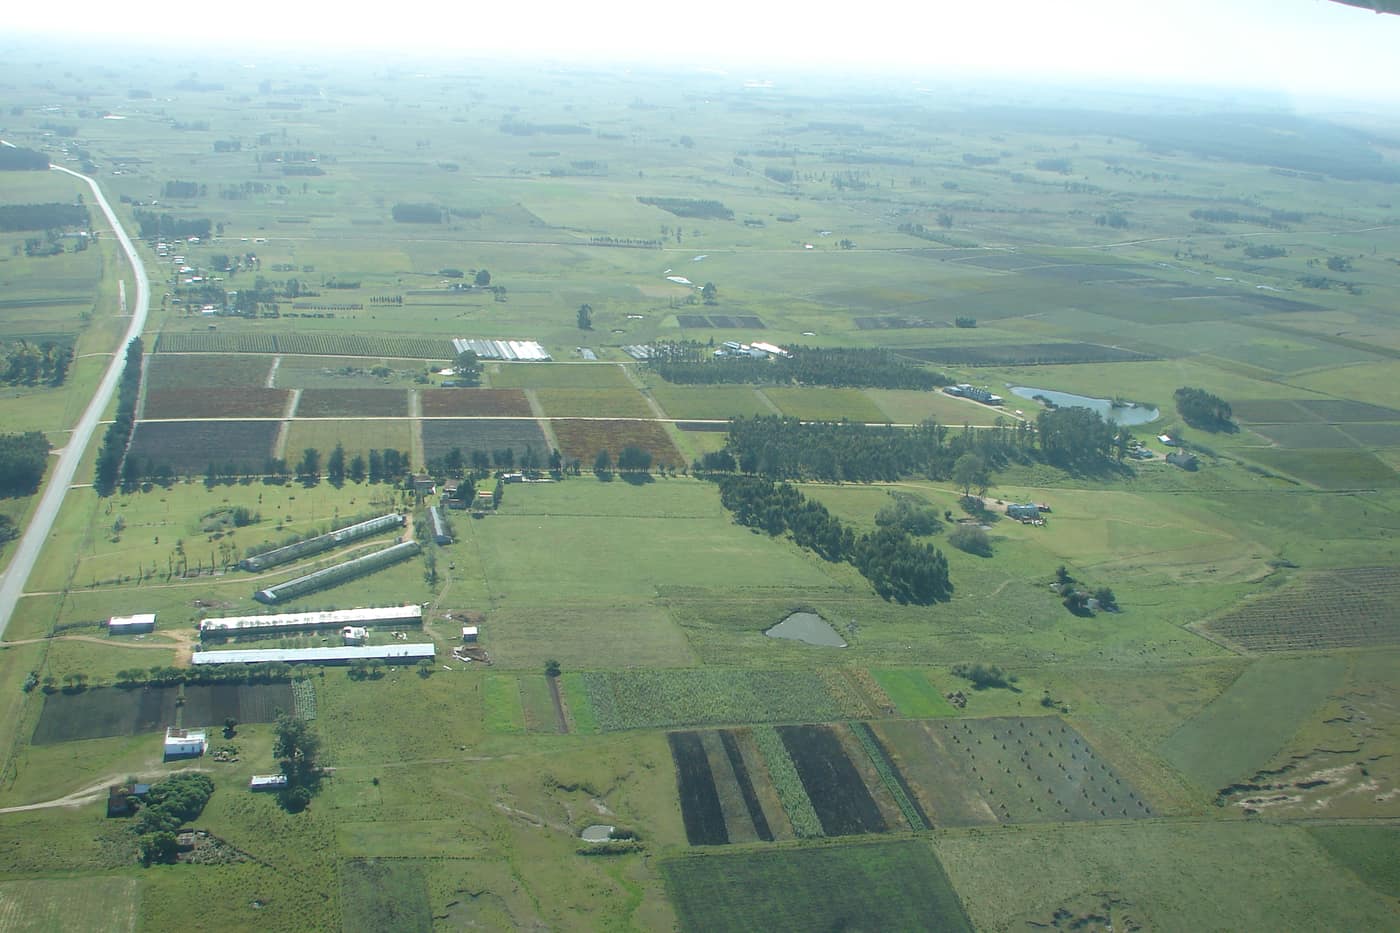
Aerial over a mosaic of fields
Aerial over a mosaic of fieldsDaniel Pereyra Collazo · Public domain
Traded 202518,180ha
LocationLitoral, on the Río Uruguay
Land useIndustrial-scale cropping, forestry, cattle

The price

The 2025 average was USD 5,138 per hectare, 9 % below the previous year. Even after that fall, Río Negro remains among the country's six most expensive departments.

The number that matters here

44 contracts, 18,180 hectares. That is a mean parcel of 413 hectares, the second highest in Uruguay. For comparison, Canelones sits at 33.

Río Negro is agro-industrial. Large-scale cropping in soy, wheat and barley, plus forestry and the pulp mill near Fray Bentos as an industrial offtaker. Buying here usually means buying a finished operation rather than land to assemble.

What a thin market means

Few transactions cut both ways. Serious properties trade here, but suitable supply appears irregularly. For a buyer that means allowing lead time and being ready to decide when the right property appears, rather than waiting for the next one.

  • Suits: buyers targeting operational scale on a multi-year horizon
  • Does not suit: small entry parcels, a short buying window

Sources

Figures verified on 2026-07-27

Information is provided for information purposes only and does not constitute investment, legal or tax advice. Prices shown are averages from official statistics, not valuations of individual properties.

The series for this department

Prices actually paid per hectare, area traded and the number of contracts of sale, year by year.

  • Since2000
  • Peak6,264 2014
  • Low370 2001
Río Negro: Prices actually paid per hectare, area traded and the number of contracts of sale, year by year.
YearUSD/haChangeHectares tradedContracts
200057713,83743
2001370−35.9 %33,66763
2002639+72.7 %21,91452
2003756+18.3 %67,52086
20041,483+96.2 %77,269136
20051,246−16 %74,830122
20061,509+21.1 %67,62282
20071,563+3.6 %59,640133
20081,842+17.9 %44,69777
20093,070+66.7 %25,06154
20103,591+17 %26,30159
20115,946+65.6 %20,44147
20125,541−6.8 %14,74544
20135,122−7.6 %11,68836
20146,264+22.3 %12,60925
20156,236−0.4 %6,60823
20164,047−35.1 %7,39417
20173,338−17.5 %5,15616
20186,155+84.4 %1,81411
20195,208−15.4 %10,83226
20203,474−33.3 %9,88428
20214,858+39.8 %10,54925
20225,763+18.6 %14,63135
20234,607−20.1 %12,08329
20245,648+22.6 %13,03634
20255,138−9 %18,18044

Source: DIEA / MGAP, "Precio de la Tierra" series. Change against the previous year, computed from the same figures. Reconciled on 2026-07-27

The market report

Ten pages: what land costs in each of the 18 departments, what leasing yields, what a purchase adds on top, and the rules under which a foreigner may buy at all. Every figure with a source and a verification date.

  • Prices for all 18 departments, from registered contracts of sale
  • Gross yield from the official lease and price series, unvarnished
  • Transaction costs with rates, and what they come to on an average parcel
  • The ceilings in Canada and Argentina, with the statutes behind them

You receive the report immediately as a PDF. We also write when DIEA publishes new figures, normally twice a year. No advertising, never sold on, unsubscribe in every message.

Assess properties in this region

We benchmark every property against the most recently published comparable transactions in the same zone before any price is discussed.

Schedule a consultation

Other regions