Regions

Farmland in Artigas

Artigas is Uruguay's cheapest department, in 2025 as in 2024. The price is the lowest in the country, and the reasons are legible.

Avg price 2025 2,300 USD/haTraded 2025 12,673 haLand use Extensive cattle, rice, sugar cane
USD per hectare · DIEA 2025Spread, most to least expensive department 4.2×

Bar length and order follow the official annual figures. Percentage: change against 2024.
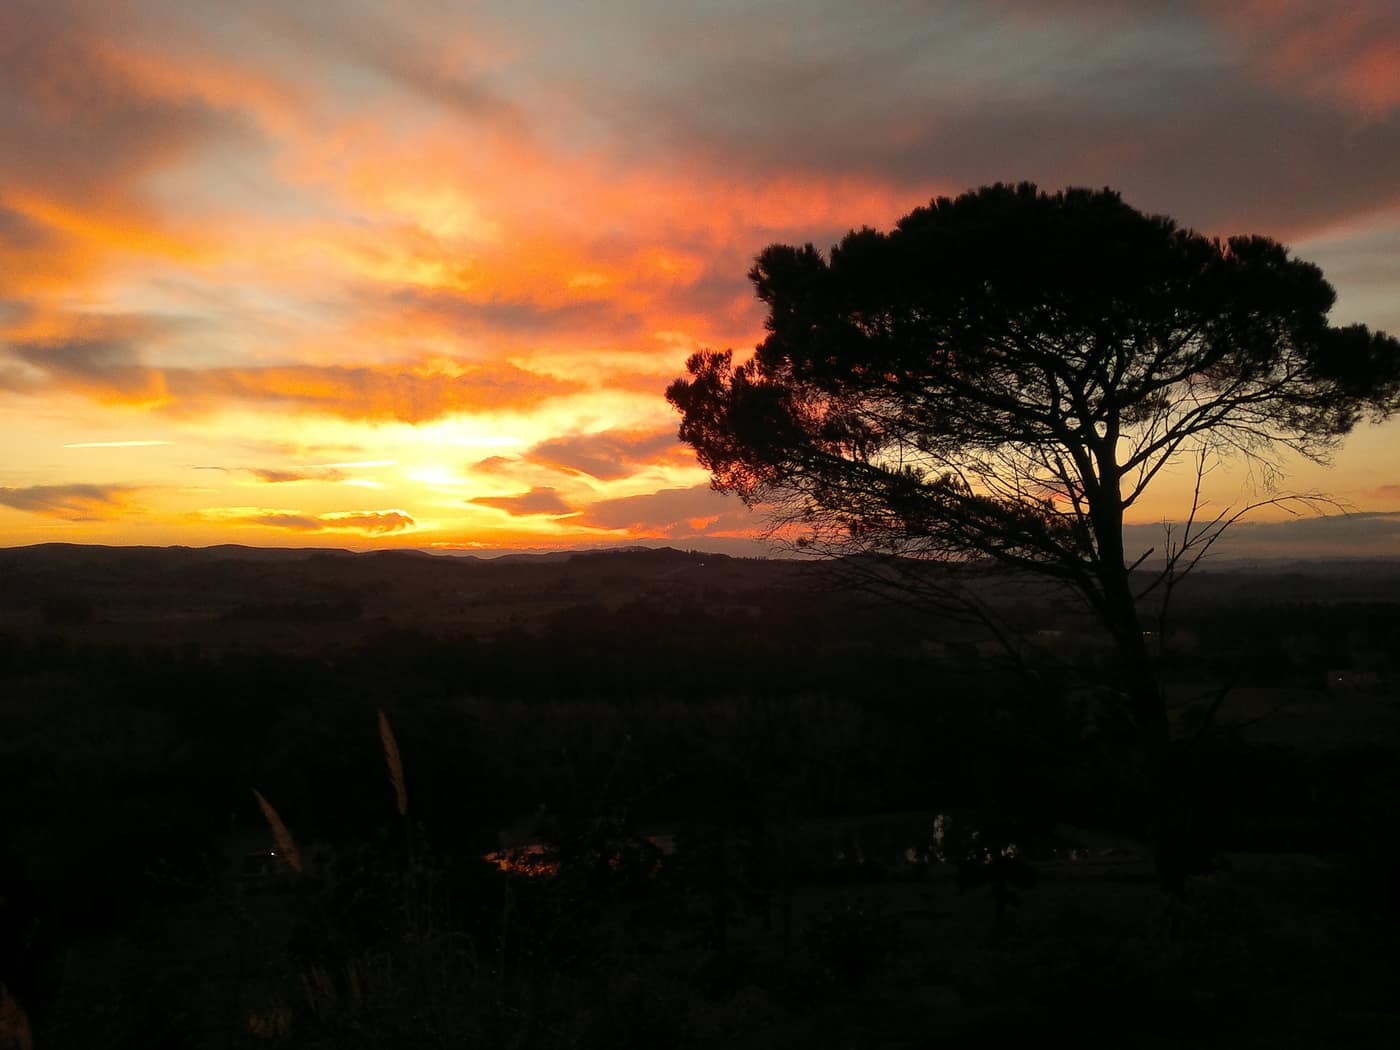
Umbrella pine at dusk
Umbrella pine at duskWikimedia Commons · CC BY-SA 3.0
Traded 202512,673ha
LocationFar north, Brazilian and Argentine border
Land useExtensive cattle, rice, sugar cane

The price

At USD 2,300 per hectare, Artigas was Uruguay's cheapest department in 2025, essentially unchanged from USD 2,312 in 2024. The gap to Colonia, the most expensive, is a factor of 4.2.

Where the low price comes from

Two factors combine. The first is soil: Artigas sits largely on shallow basalt soils that carry extensive grazing but are of limited use for intensive cropping.

The second is location. Artigas is the northernmost corner of the country, some 600 road kilometres from Montevideo. Every tonne that has to reach the port carries that distance as cost, and it is priced into the hectare.

What does work here

Rice is grown along the Río Cuareim and sugar cane around Bella Unión, both on irrigated ground with an entirely different yield profile from basalt pasture. The same caution applies: the departmental average describes no individual property.

For buyers, Artigas answers one specific question: maximum area per dollar deployed, with extensive use and a long horizon. Anyone prioritising access, soil quality or resale should look further south.

Sources

Figures verified on 2026-07-27

Information is provided for information purposes only and does not constitute investment, legal or tax advice. Prices shown are averages from official statistics, not valuations of individual properties.

The series for this department

Prices actually paid per hectare, area traded and the number of contracts of sale, year by year.

  • Since2000
  • Peak2,476 2022
  • Low226 2000
Artigas: Prices actually paid per hectare, area traded and the number of contracts of sale, year by year.
YearUSD/haChangeHectares tradedContracts
200022636,56666
2001333+47.3 %27,08163
2002235−29.4 %19,87158
2003245+4.3 %35,12171
2004361+47.3 %48,81995
2005420+16.3 %39,840101
2006473+12.6 %55,888123
2007590+24.7 %41,505142
2008696+18 %27,93284
20091,184+70.1 %23,34074
20101,334+12.7 %21,20479
20111,461+9.5 %16,37982
20122,079+42.3 %15,71968
20131,624−21.9 %26,20380
20142,291+41.1 %12,29447
20151,647−28.1 %4,56233
20161,939+17.7 %7,65034
20171,786−7.9 %5,51330
20181,818+1.8 %5,27222
20191,896+4.3 %5,63238
20201,367−27.9 %6,85930
20211,500+9.7 %4,30523
20222,476+65.1 %16,63054
20231,993−19.5 %14,68543
20242,312+16 %10,77155
20252,300−0.5 %12,67353

Source: DIEA / MGAP, "Precio de la Tierra" series. Change against the previous year, computed from the same figures. Reconciled on 2026-07-27

The market report

Ten pages: what land costs in each of the 18 departments, what leasing yields, what a purchase adds on top, and the rules under which a foreigner may buy at all. Every figure with a source and a verification date.

  • Prices for all 18 departments, from registered contracts of sale
  • Gross yield from the official lease and price series, unvarnished
  • Transaction costs with rates, and what they come to on an average parcel
  • The ceilings in Canada and Argentina, with the statutes behind them

You receive the report immediately as a PDF. We also write when DIEA publishes new figures, normally twice a year. No advertising, never sold on, unsubscribe in every message.

Assess properties in this region

We benchmark every property against the most recently published comparable transactions in the same zone before any price is discussed.

Schedule a consultation

Other regions