Regions

Farmland in Durazno

Durazno sits at the geographic centre of Uruguay and was the country's second most active department by trading volume in 2025.

Avg price 2025 4,032 USD/haTraded 2025 25,464 haLand use Livestock, increasingly cropping and forestry
USD per hectare · DIEA 2025Spread, most to least expensive department 4.2×

Bar length and order follow the official annual figures. Percentage: change against 2024.
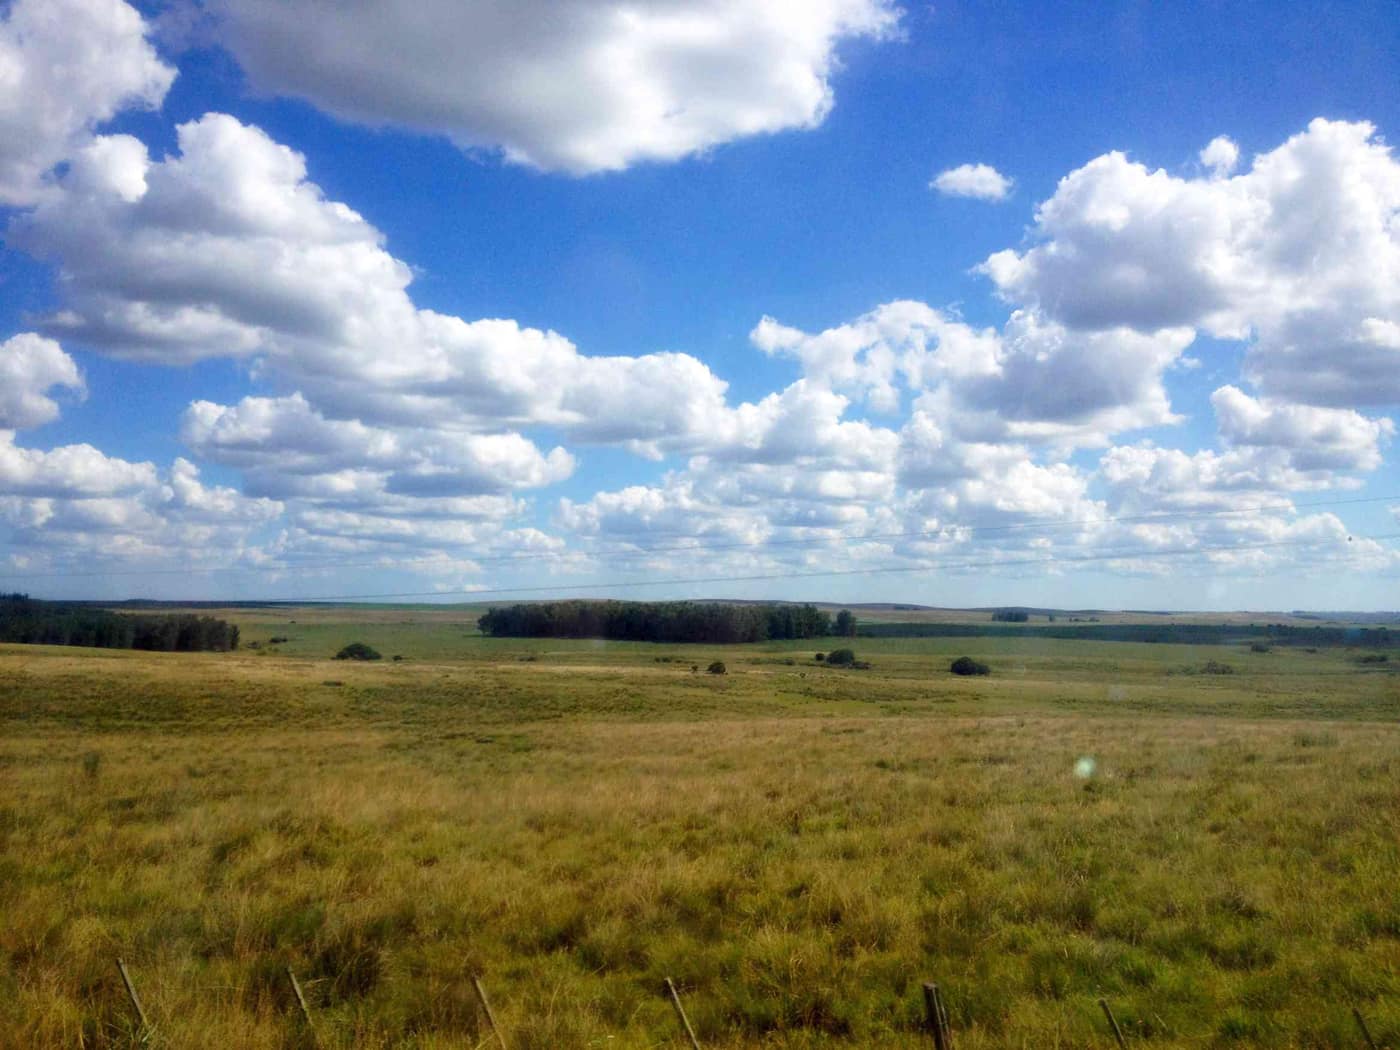
Grassland under open sky
Grassland under open skyFLASHPACKER TRAVELGUIDE · CC BY-SA 2.0
Traded 202525,464ha
LocationCentral, on the Río Negro
Land useLivestock, increasingly cropping and forestry

Trading volume

With 25,464 hectares traded, Durazno ranked second among the most active departments in 2025, behind Paysandú (31,999 ha) and ahead of Treinta y Tres (23,994 ha).

The 2025 average was USD 4,032 per hectare against USD 4,885 the year before, a fall of 17.5 %. Across 98 contracts covering 25,464 hectares the mean parcel is 260 hectares, well above the national figure.

The central position

Durazno is reachable within a few hours from practically anywhere in Uruguay and sits on Ruta 5, the main artery connecting Montevideo to the north. For large operations with transport requirements that is a real advantage.

Durazno is traditionally livestock country. Land use has diversified in recent years: cropping on the better ground, forestry on lighter soils. That mix makes the department interesting for investors seeking land with development potential rather than fully optimised operations.

Sources

Figures verified on 2026-07-27

Information is provided for information purposes only and does not constitute investment, legal or tax advice. Prices shown are averages from official statistics, not valuations of individual properties.

The series for this department

Prices actually paid per hectare, area traded and the number of contracts of sale, year by year.

  • Since2000
  • Peak4,885 2024
  • Low316 2000
Durazno: Prices actually paid per hectare, area traded and the number of contracts of sale, year by year.
YearUSD/haChangeHectares tradedContracts
200031631,30195
2001325+2.8 %50,688127
2002367+12.9 %24,133104
2003332−9.5 %56,330150
2004460+38.6 %57,705183
2005606+31.7 %61,845160
20061,042+71.9 %64,544213
20071,853+77.8 %70,048188
20081,827−1.4 %34,605137
20092,344+28.3 %28,08989
20102,699+15.1 %33,950104
20113,222+19.4 %29,142124
20123,414+6 %16,415103
20133,352−1.8 %21,202105
20144,320+28.9 %13,93653
20153,365−22.1 %7,45852
20163,886+15.5 %16,48352
20173,045−21.6 %12,87254
20182,799−8.1 %16,67354
20192,983+6.6 %17,33153
20202,987+0.1 %16,03058
20213,155+5.6 %17,13753
20223,605+14.3 %20,83180
20234,093+13.5 %13,39476
20244,885+19.4 %36,15591
20254,032−17.5 %25,46498

Source: DIEA / MGAP, "Precio de la Tierra" series. Change against the previous year, computed from the same figures. Reconciled on 2026-07-27

The market report

Ten pages: what land costs in each of the 18 departments, what leasing yields, what a purchase adds on top, and the rules under which a foreigner may buy at all. Every figure with a source and a verification date.

  • Prices for all 18 departments, from registered contracts of sale
  • Gross yield from the official lease and price series, unvarnished
  • Transaction costs with rates, and what they come to on an average parcel
  • The ceilings in Canada and Argentina, with the statutes behind them

You receive the report immediately as a PDF. We also write when DIEA publishes new figures, normally twice a year. No advertising, never sold on, unsubscribe in every message.

Assess properties in this region

We benchmark every property against the most recently published comparable transactions in the same zone before any price is discussed.

Schedule a consultation

Other regions