Regions

Farmland in Lavalleja

Lavalleja combines low per-hectare prices with the most striking landscape in the country, and it has the second-highest number of purchase contracts.

Avg price 2025 3,736 USD/haTraded 2025 15,983 haLand use Cattle and sheep, forestry, quarrying
USD per hectare · DIEA 2025Spread, most to least expensive department 4.2×

Bar length and order follow the official annual figures. Percentage: change against 2024.
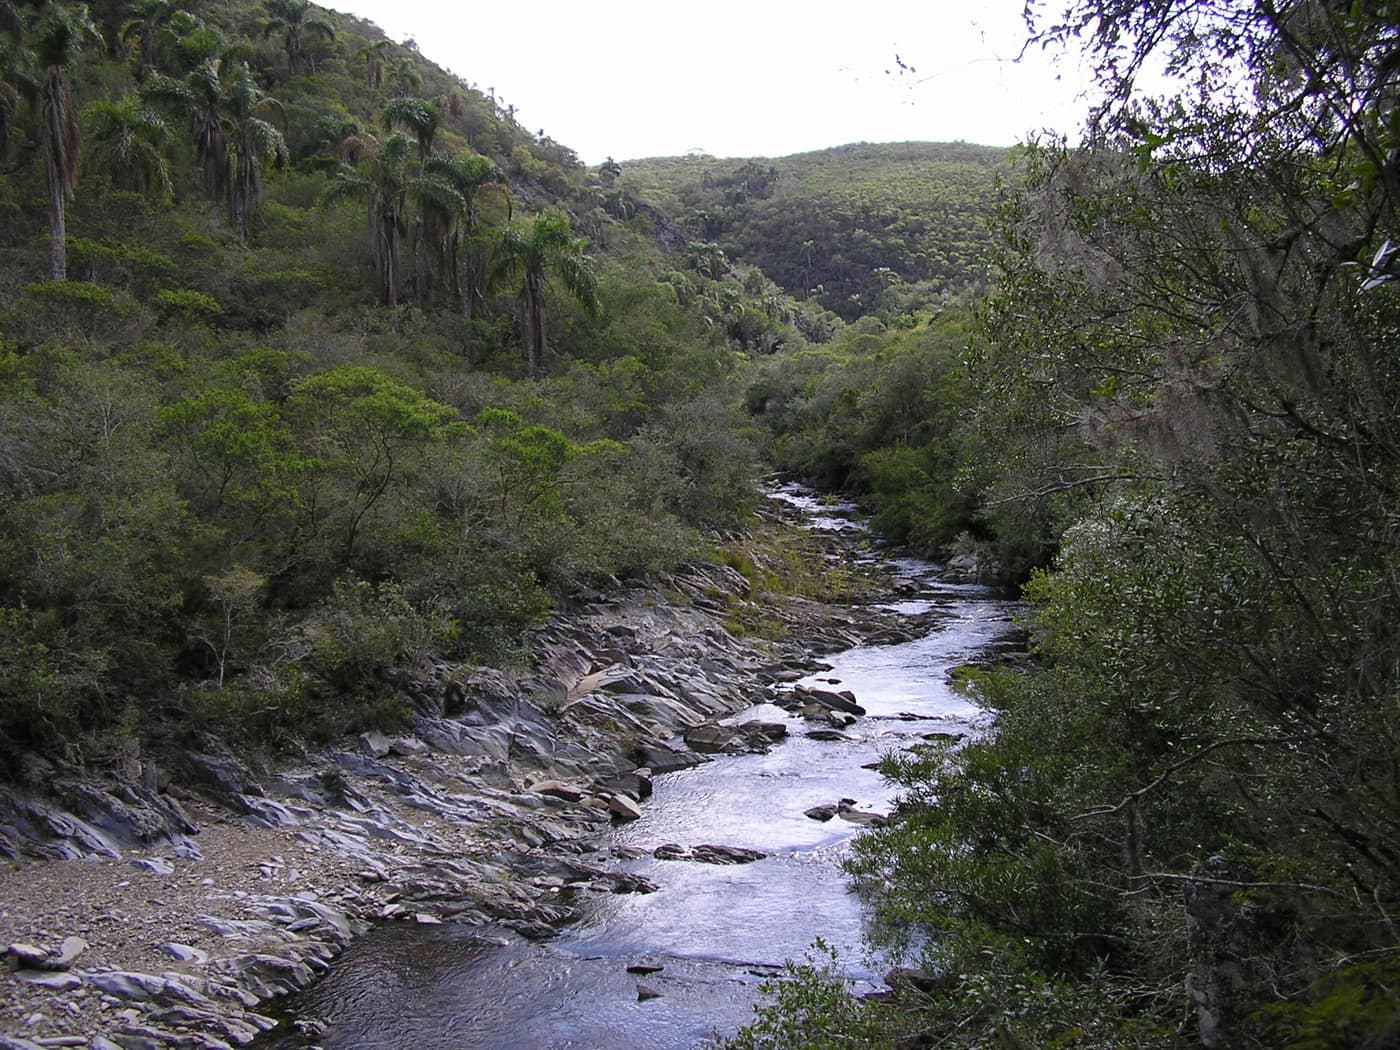
Stream in the sierras
Stream in the sierrasMarina Miranda · CC BY-SA 3.0
Traded 202515,983ha
LocationSoutheast, sierras
Land useCattle and sheep, forestry, quarrying

The price

Lavalleja averaged USD 3,736 per hectare in 2025, up 5.1 % year on year and about 11 % below the national figure.

An active market in mid sizes

With 160 purchase contracts over 15,983 hectares, Lavalleja had the second-highest transaction count in the country in 2025. The mean parcel is exactly 100 hectares. For a first-time buyer that is an unusually accessible combination: plenty of supply at a size reachable with moderate capital.

Sierras, not arable plain

The landscape of ridges, rock formations and watercourses around Minas shapes the land use. Cropping is limited to the flatter ground; the emphasis is cattle and sheep, with forestry and local quarrying. If you are principally after row-crop ground, the Litoral is the better address.

Conversely, the topography carries a market value that a pure yield lens misses. Lavalleja is weekend country, a little over two hours from Montevideo, and land with water, rock and a view finds a second set of buyers.

Sources

Figures verified on 2026-07-27

Information is provided for information purposes only and does not constitute investment, legal or tax advice. Prices shown are averages from official statistics, not valuations of individual properties.

The series for this department

Prices actually paid per hectare, area traded and the number of contracts of sale, year by year.

  • Since2000
  • Peak3,900 2023
  • Low389 2003
Lavalleja: Prices actually paid per hectare, area traded and the number of contracts of sale, year by year.
YearUSD/haChangeHectares tradedContracts
200058016,329147
2001449−22.6 %36,333199
2002456+1.6 %17,499150
2003389−14.7 %24,692215
2004677+74 %33,629239
2005606−10.5 %47,794262
20061,310+116.2 %41,540237
20071,135−13.4 %48,455290
20081,817+60.1 %37,859271
20092,161+18.9 %15,165127
20102,634+21.9 %32,235155
20112,362−10.3 %17,697178
20122,957+25.2 %28,989194
20132,843−3.9 %31,409151
20142,881+1.3 %15,622138
20152,945+2.2 %14,344111
20162,732−7.2 %14,78494
20173,517+28.7 %17,904124
20183,017−14.2 %26,82979
20193,098+2.7 %7,51191
20202,915−5.9 %10,060107
20212,936+0.7 %36,737155
20223,084+5 %36,312175
20233,900+26.5 %21,072138
20243,557−8.8 %15,066175
20253,736+5 %15,983160

Source: DIEA / MGAP, "Precio de la Tierra" series. Change against the previous year, computed from the same figures. Reconciled on 2026-07-27

The market report

Ten pages: what land costs in each of the 18 departments, what leasing yields, what a purchase adds on top, and the rules under which a foreigner may buy at all. Every figure with a source and a verification date.

  • Prices for all 18 departments, from registered contracts of sale
  • Gross yield from the official lease and price series, unvarnished
  • Transaction costs with rates, and what they come to on an average parcel
  • The ceilings in Canada and Argentina, with the statutes behind them

You receive the report immediately as a PDF. We also write when DIEA publishes new figures, normally twice a year. No advertising, never sold on, unsubscribe in every message.

Assess properties in this region

We benchmark every property against the most recently published comparable transactions in the same zone before any price is discussed.

Schedule a consultation

Other regions