Regions

Land in Rocha

Rocha recorded the largest price increase of any Uruguayan department in 2025. Two separate groups of buyers are competing for the same ground.

Avg price 2025 3,839 USD/haTraded 2025 19,295 haLand use Rice, extensive cattle, coastal use
USD per hectare · DIEA 2025Spread, most to least expensive department 4.2×

Bar length and order follow the official annual figures. Percentage: change against 2024.
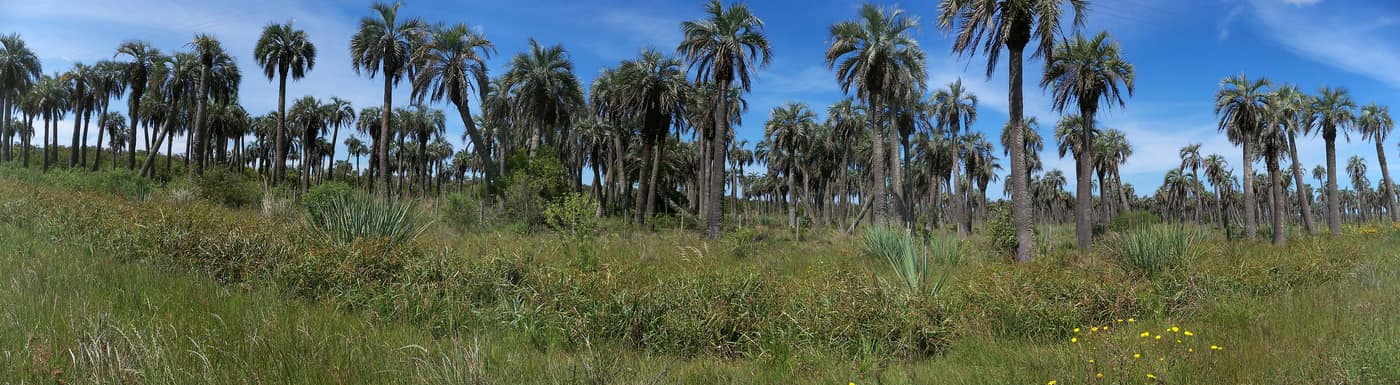
Butiá palm grove
Butiá palm grovebutiacero · CC BY-SA 3.0
Traded 202519,295ha
LocationEast, Atlantic coast
Land useRice, extensive cattle, coastal use

The price

Rocha averaged USD 3,839 per hectare in 2025, against USD 3,139 in 2024. That is a 22.3 % rise, the largest in the country, and it came on 145 contracts, so the market behind it is well evidenced.

Two demands on one piece of ground

The first driver is agricultural. Rocha forms part of the rice belt in the Laguna Merín basin, one of South America's highest-yielding rice regions, with extensive cattle on the grassland between.

The second driver is the coast. Rocha has Uruguay's least developed Atlantic shoreline, from La Paloma and La Pedrera to Cabo Polonio and Punta del Diablo. Demand for land near the coast comes from an entirely different motive, but meets the same limited supply.

What to check

A large share of the department is protected. The Bañados del Este are a UNESCO biosphere reserve, and wetlands carry use restrictions. In Rocha, what may be done with which hectare is not a footnote but the core of pre-purchase diligence.

Sources

Figures verified on 2026-07-27

Information is provided for information purposes only and does not constitute investment, legal or tax advice. Prices shown are averages from official statistics, not valuations of individual properties.

The series for this department

Prices actually paid per hectare, area traded and the number of contracts of sale, year by year.

  • Since2000
  • Peak3,980 2015
  • Low394 2001
Rocha: Prices actually paid per hectare, area traded and the number of contracts of sale, year by year.
YearUSD/haChangeHectares tradedContracts
200054023,309162
2001394−27 %44,195171
2002467+18.5 %22,178141
2003494+5.8 %31,143163
2004626+26.7 %35,298191
2005619−1.1 %60,708257
20061,086+75.4 %42,933253
20071,348+24.1 %37,514178
20081,537+14 %38,306236
20093,561+131.7 %13,955125
20102,650−25.6 %29,255197
20113,757+41.8 %22,168155
20123,327−11.4 %19,833134
20132,934−11.8 %16,29890
20143,716+26.7 %6,77675
20153,980+7.1 %15,54268
20162,783−30.1 %3,99248
20173,326+19.5 %5,16267
20182,690−19.1 %10,70245
20192,715+0.9 %7,35659
20203,041+12 %4,75460
20212,588−14.9 %19,02688
20223,487+34.7 %13,293102
20232,940−15.7 %25,49295
20243,139+6.8 %15,838110
20253,839+22.3 %19,295145

Source: DIEA / MGAP, "Precio de la Tierra" series. Change against the previous year, computed from the same figures. Reconciled on 2026-07-27

The market report

Ten pages: what land costs in each of the 18 departments, what leasing yields, what a purchase adds on top, and the rules under which a foreigner may buy at all. Every figure with a source and a verification date.

  • Prices for all 18 departments, from registered contracts of sale
  • Gross yield from the official lease and price series, unvarnished
  • Transaction costs with rates, and what they come to on an average parcel
  • The ceilings in Canada and Argentina, with the statutes behind them

You receive the report immediately as a PDF. We also write when DIEA publishes new figures, normally twice a year. No advertising, never sold on, unsubscribe in every message.

Assess properties in this region

We benchmark every property against the most recently published comparable transactions in the same zone before any price is discussed.

Schedule a consultation

Other regions