Bar length and order follow the official annual figures. Percentage: change against 2024.
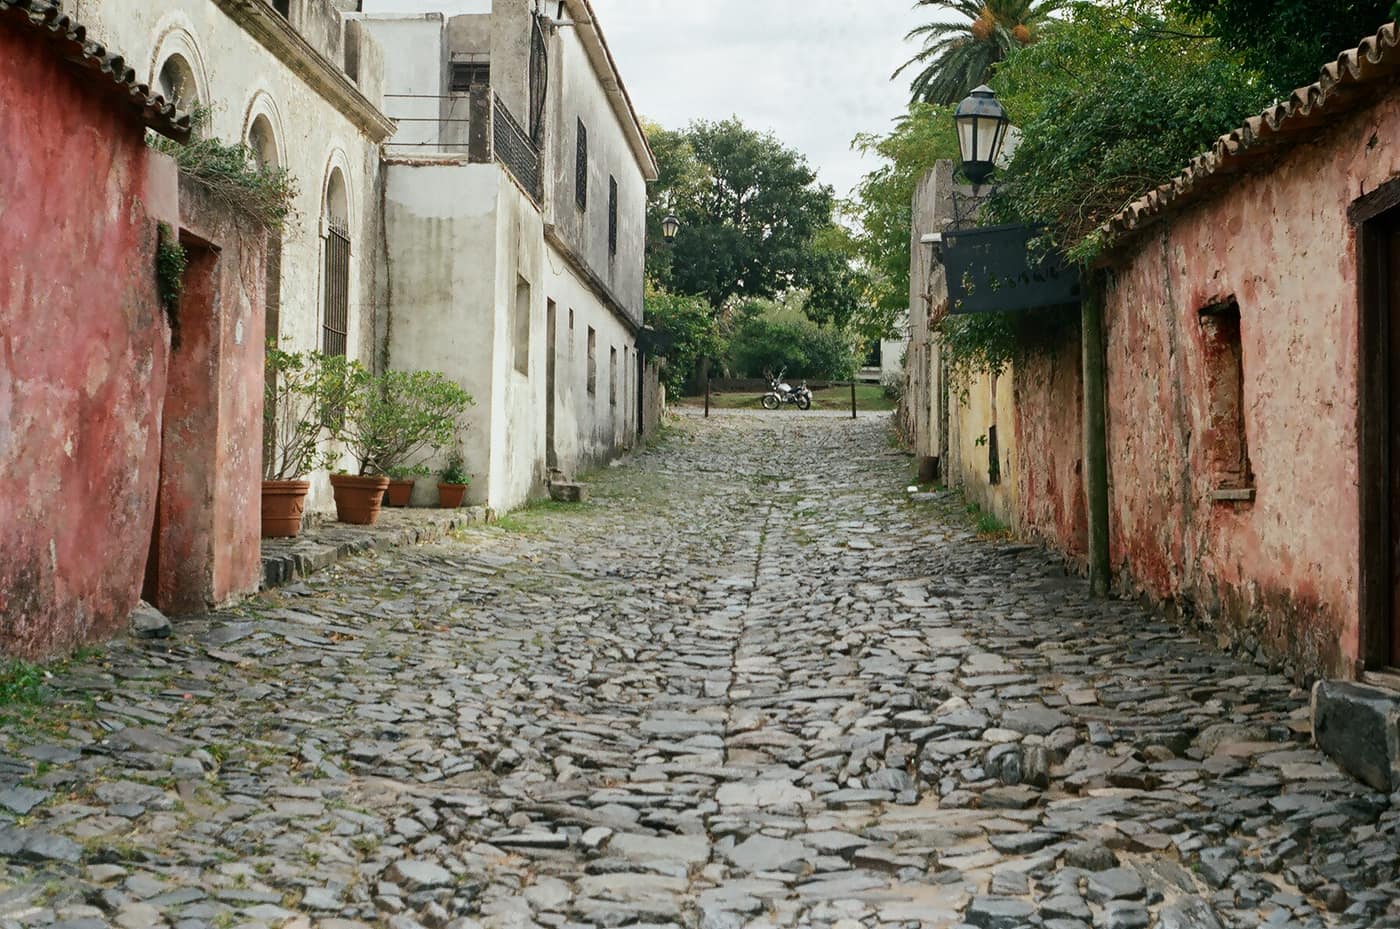
Cobbled street, Colonia del SacramentoZonda Bez from brasilia/df, Brasil · CC BY-SA 2.0
Traded 20257,891ha
LocationSouthwest, on the Río de la Plata
Land useIntensive cropping, dairy, mixed farming
The price
At an average of USD 9,707 per hectare, Colonia was Uruguay's most expensive department in 2025: more than double the national average of USD 4,178/ha.
Why Colonia commands a premium
Three factors combine: high-quality soils with above-average CONEAT ratings, intensive use for cropping and dairy, and proximity to Montevideo as well as the ferry link to Buenos Aires. Colonia is the best-connected agricultural area in the country.
A further factor is easy to miss in a pure yield calculation: Colonia del Sacramento is a UNESCO World Heritage site, the region is developed for tourism and pleasant to live in. Buyers combining production with a habitable country seat pay a premium here that per-hectare output alone does not explain.
Who Colonia suits
Buyers prioritising top soil quality and liquidity over entry price
Mixed use combining production with personal occupation
Investors needing short access to Montevideo and international air links
What Colonia does not suit: capital-efficient scale. The same budget buys a multiple of the hectares further inland.
Information is provided for information purposes only and does not constitute investment, legal or tax advice. Prices shown are averages from official statistics, not valuations of individual properties.
The series for this department
Prices actually paid per hectare, area traded and the number of contracts of sale, year by year.
Since2000
Peak9,707 2025
Low599 2000
Colonia: Prices actually paid per hectare, area traded and the number of contracts of sale, year by year.
Year
USD/ha
Change
Hectares traded
Contracts
2000
599
15,901
151
2001
827
+38.1 %
17,518
201
2002
637
−23 %
19,285
197
2003
742
+16.5 %
27,790
231
2004
876
+18.1 %
33,581
301
2005
1,170
+33.6 %
25,148
296
2006
2,334
+99.5 %
9,547
139
2007
2,255
−3.4 %
19,324
267
2008
3,141
+39.3 %
16,115
202
2009
4,151
+32.2 %
11,228
166
2010
4,294
+3.4 %
12,947
159
2011
5,052
+17.7 %
12,177
149
2012
6,358
+25.9 %
10,289
170
2013
6,079
−4.4 %
8,530
132
2014
5,510
−9.4 %
5,644
100
2015
7,047
+27.9 %
6,760
106
2016
5,570
−21 %
5,093
78
2017
5,661
+1.6 %
6,195
106
2018
5,433
−4 %
4,961
83
2019
5,581
+2.7 %
5,677
76
2020
5,291
−5.2 %
4,560
79
2021
6,109
+15.5 %
7,584
110
2022
6,904
+13 %
8,838
144
2023
8,437
+22.2 %
5,191
103
2024
8,111
−3.9 %
8,790
128
2025
9,707
+19.7 %
7,891
134
Source: DIEA / MGAP, "Precio de la Tierra" series. Change against the previous year, computed from the same figures. Reconciled on 2026-07-27
The market report
Ten pages: what land costs in each of the 18 departments, what leasing yields, what a purchase adds on top, and the rules under which a foreigner may buy at all. Every figure with a source and a verification date.
Prices for all 18 departments, from registered contracts of sale
Gross yield from the official lease and price series, unvarnished
Transaction costs with rates, and what they come to on an average parcel
The ceilings in Canada and Argentina, with the statutes behind them
You receive the report immediately as a PDF. We also write when DIEA publishes new figures, normally twice a year. No advertising, never sold on, unsubscribe in every message.
Assess properties in this region
We benchmark every property against the most recently published comparable transactions in the same zone before any price is discussed.