Regions

Farmland in Canelones

Canelones is Uruguay's smallholding market. Nowhere do more properties change hands, and nowhere are they smaller.

Avg price 2025 6,492 USD/haTraded 2025 5,830 haLand use Viticulture, horticulture, poultry, smallholdings
USD per hectare · DIEA 2025Spread, most to least expensive department 4.2×

Bar length and order follow the official annual figures. Percentage: change against 2024.
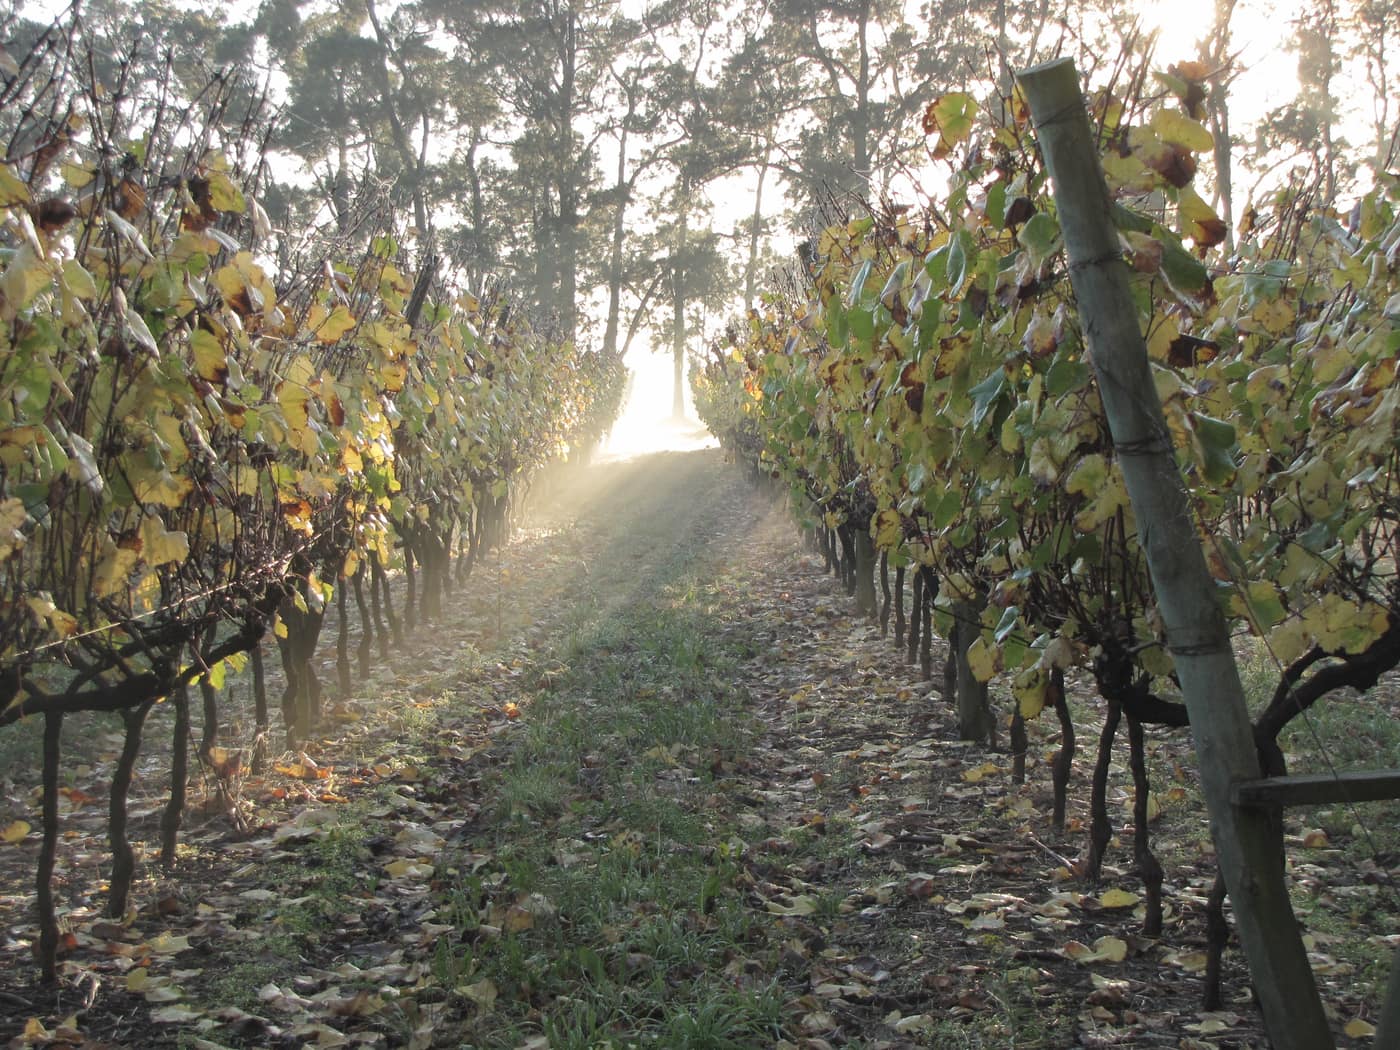
Vine rows against the light
Vine rows against the lightViñavarelazarranz · CC BY-SA 3.0
Traded 20255,830ha
LocationBelt around Montevideo
Land useViticulture, horticulture, poultry, smallholdings

The price

At USD 6,492 per hectare, Canelones sat about 55 % above the national average in 2025, though 5.7 % below its own 2024 level. Soil explains only part of that.

A market made of small pieces

The figure that separates Canelones from every other department is parcel size: 175 contracts covering 5,830 hectares works out at 33 hectares per purchase. The national figure is 151. Canelones has the most transactions in the country on the third-smallest area.

That follows directly from proximity to the capital. The belt around Montevideo was divided into smallholdings over generations: vegetables for the city, poultry, fruit and above all wine. Canelones is Uruguay's wine country, and Tannat occupies most of the planted area.

What that means for buyers

If you want a chacra within driving distance of Montevideo and Carrasco airport, this is where it is, and there is supply: the high contract count means a liquid market with plenty of comparables.

If you want to scale hectares, this is the wrong place. Assembling several hundred contiguous hectares here is structurally difficult regardless of budget.

  • Suits: small chacra, viticulture, land combined with a residence near the capital
  • Does not suit: scaling area, extensive grazing

Sources

Figures verified on 2026-07-27

Information is provided for information purposes only and does not constitute investment, legal or tax advice. Prices shown are averages from official statistics, not valuations of individual properties.

The series for this department

Prices actually paid per hectare, area traded and the number of contracts of sale, year by year.

  • Since2006
  • Peak6,886 2024
  • Low1,412 2006
Canelones: Prices actually paid per hectare, area traded and the number of contracts of sale, year by year.
YearUSD/haChangeHectares tradedContracts
20061,4124,852167
20072,172+53.8 %14,033296
20081,780−18 %10,097242
20092,929+64.6 %5,988161
20103,292+12.4 %8,403208
20113,767+14.4 %8,679243
20124,119+9.3 %7,700203
20135,229+26.9 %6,450195
20144,992−4.5 %4,322139
20153,924−21.4 %5,249132
20164,461+13.7 %3,20296
20175,423+21.6 %2,52599
20184,511−16.8 %4,285119
20194,425−1.9 %3,199101
20204,050−8.5 %4,04590
20215,408+33.5 %4,870117
20225,509+1.9 %7,213154
20235,517+0.1 %8,869166
20246,886+24.8 %6,230182
20256,492−5.7 %5,830175

Source: DIEA / MGAP, "Precio de la Tierra" series. Change against the previous year, computed from the same figures. Reconciled on 2026-07-27

The market report

Ten pages: what land costs in each of the 18 departments, what leasing yields, what a purchase adds on top, and the rules under which a foreigner may buy at all. Every figure with a source and a verification date.

  • Prices for all 18 departments, from registered contracts of sale
  • Gross yield from the official lease and price series, unvarnished
  • Transaction costs with rates, and what they come to on an average parcel
  • The ceilings in Canada and Argentina, with the statutes behind them

You receive the report immediately as a PDF. We also write when DIEA publishes new figures, normally twice a year. No advertising, never sold on, unsubscribe in every message.

Assess properties in this region

We benchmark every property against the most recently published comparable transactions in the same zone before any price is discussed.

Schedule a consultation

Other regions