Regions

Farmland in Cerro Largo

Cerro Largo is border country. That shapes more than the culture here; it shapes how prices form.

Avg price 2025 3,194 USD/haTraded 2025 20,572 haLand use Extensive cattle, rice, forestry
USD per hectare · DIEA 2025Spread, most to least expensive department 4.2×

Bar length and order follow the official annual figures. Percentage: change against 2024.
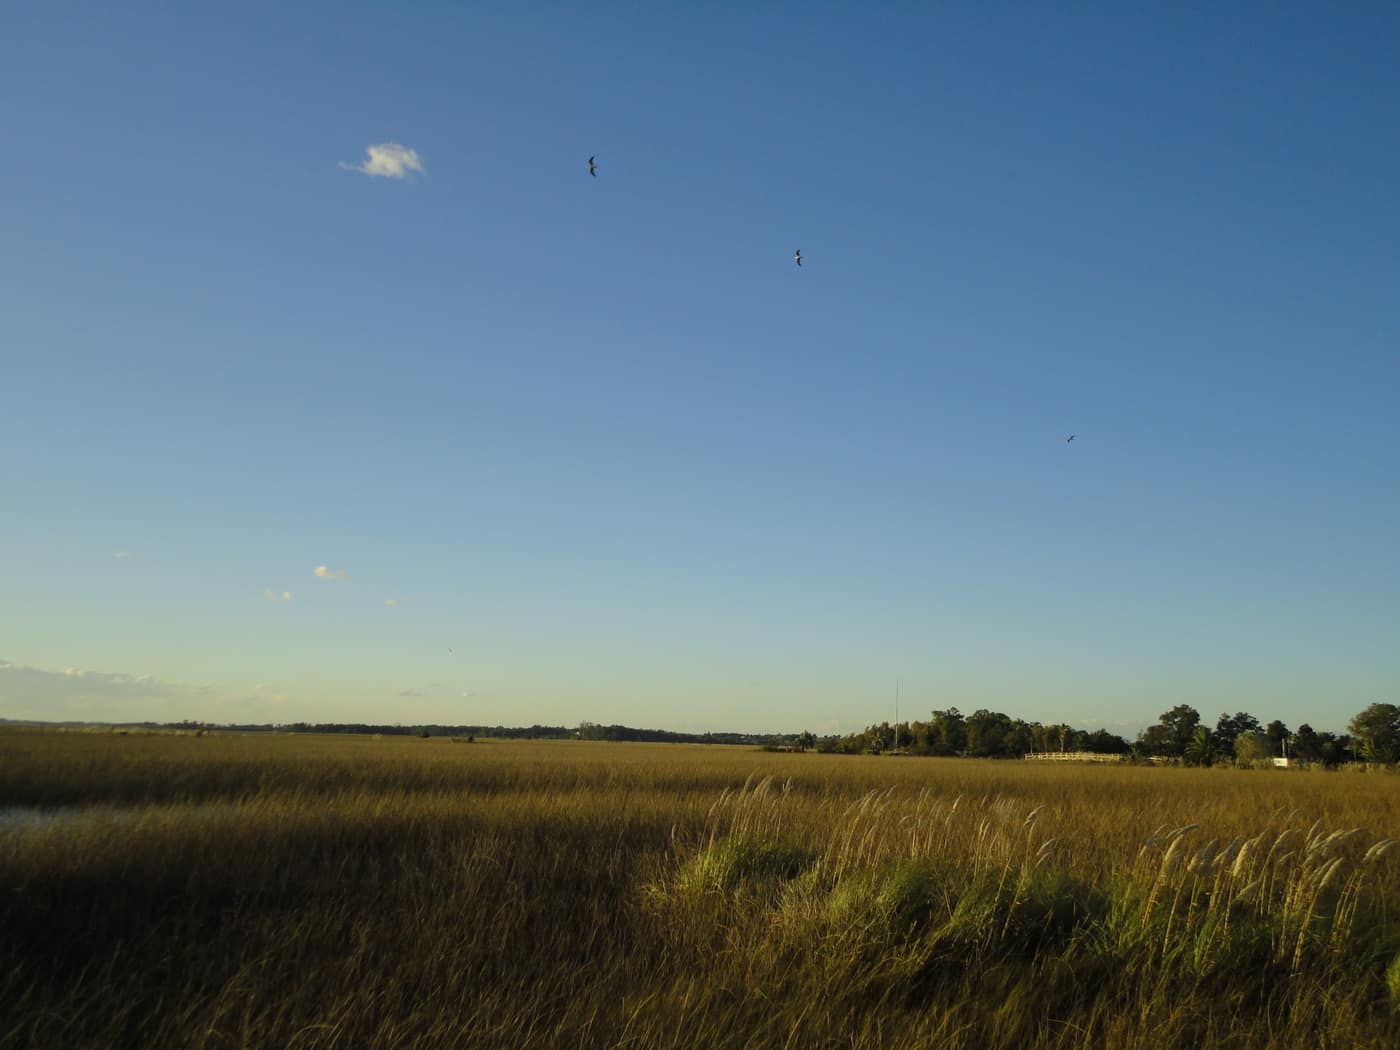
Grassland at dusk
Grassland at duskViviana de Armas · CC BY-SA 3.0
Traded 202520,572ha
LocationNortheast, Brazilian border
Land useExtensive cattle, rice, forestry

The price

The 2025 average was USD 3,194 per hectare, down 10.7 % year on year and about a quarter below the national figure. 20,572 hectares traded across 111 contracts, so the market has real depth.

What the border does

Melo lies under 90 kilometres from Río Branco and the Brazilian frontier. Brazilian buyers and tenants have long been active in Cerro Largo, which partly couples local demand to the neighbouring economy and its exchange rate.

For a European buyer that is an extra variable rather than a warning. You simply need to know it: when the real weakens against the dollar, part of the market's willingness to pay shifts without anything having changed inside Uruguay.

Land use

Traditionally Cerro Largo is cattle country on extensive grassland. Recent years added rice on the flatter ground towards Laguna Merín, and planted forestry. A mean parcel of 185 hectares describes a market trading operating units, not smallholdings.

Sources

Figures verified on 2026-07-27

Information is provided for information purposes only and does not constitute investment, legal or tax advice. Prices shown are averages from official statistics, not valuations of individual properties.

The series for this department

Prices actually paid per hectare, area traded and the number of contracts of sale, year by year.

  • Since2000
  • Peak4,079 2014
  • Low279 2003
Cerro Largo: Prices actually paid per hectare, area traded and the number of contracts of sale, year by year.
YearUSD/haChangeHectares tradedContracts
200039128,588125
2001406+3.8 %44,966153
2002303−25.4 %17,922125
2003279−7.9 %39,809142
2004416+49.1 %43,252195
2005459+10.3 %98,745220
2006885+92.8 %98,236283
20071,092+23.4 %67,362208
20082,142+96.2 %77,836219
20091,778−17 %20,016121
20101,403−21.1 %25,124167
20112,047+45.9 %32,860162
20122,652+29.6 %30,056118
20132,785+5 %28,589130
20144,079+46.5 %18,08766
20152,708−33.6 %18,15663
20162,958+9.2 %10,99543
20173,478+17.6 %27,49060
20182,394−31.2 %8,26563
20192,805+17.2 %32,24651
20201,950−30.5 %6,14245
20212,383+22.2 %11,72655
20222,770+16.2 %19,63786
20232,474−10.7 %16,49484
20243,577+44.6 %36,561117
20253,194−10.7 %20,572111

Source: DIEA / MGAP, "Precio de la Tierra" series. Change against the previous year, computed from the same figures. Reconciled on 2026-07-27

The market report

Ten pages: what land costs in each of the 18 departments, what leasing yields, what a purchase adds on top, and the rules under which a foreigner may buy at all. Every figure with a source and a verification date.

  • Prices for all 18 departments, from registered contracts of sale
  • Gross yield from the official lease and price series, unvarnished
  • Transaction costs with rates, and what they come to on an average parcel
  • The ceilings in Canada and Argentina, with the statutes behind them

You receive the report immediately as a PDF. We also write when DIEA publishes new figures, normally twice a year. No advertising, never sold on, unsubscribe in every message.

Assess properties in this region

We benchmark every property against the most recently published comparable transactions in the same zone before any price is discussed.

Schedule a consultation

Other regions