Regions

Farmland in Florida

Florida sits in the middle of the country geographically and on price, and was among the strongest risers of 2025.

Avg price 2025 5,265 USD/haTraded 2025 15,882 haLand use Dairy, cropping, cattle
USD per hectare · DIEA 2025Spread, most to least expensive department 4.2×

Bar length and order follow the official annual figures. Percentage: change against 2024.
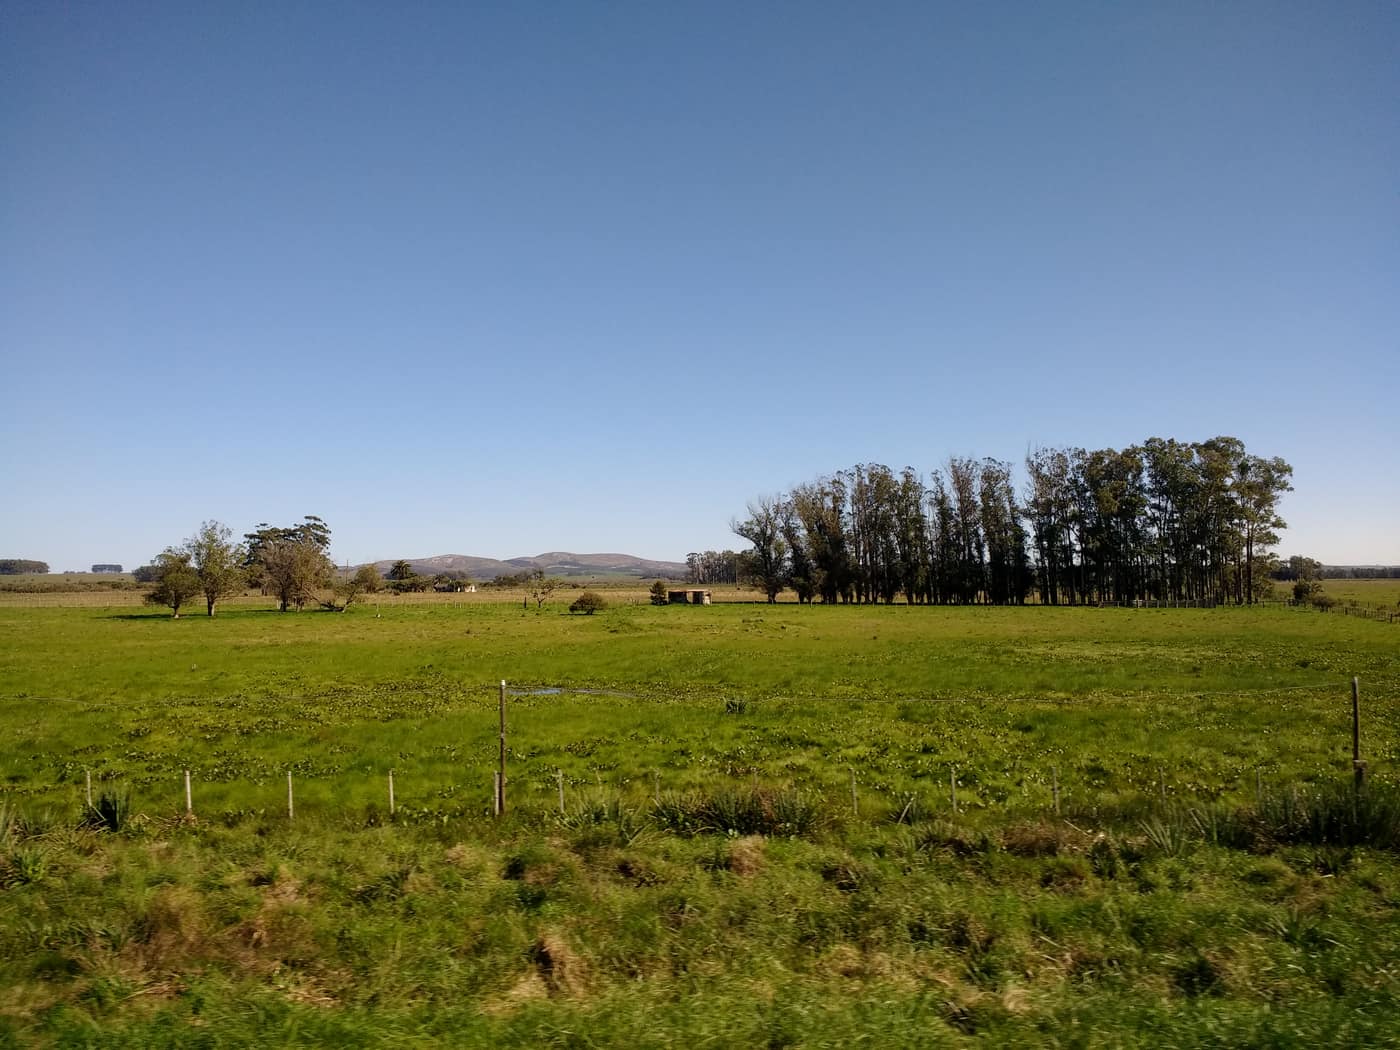
Pasture with fence and treeline
Pasture with fence and treelineMx. Granger · CC0
Traded 202515,882ha
LocationCentre, north of Montevideo
Land useDairy, cropping, cattle

The price

Florida averaged USD 5,265 per hectare in 2025, up 12.3 % from USD 4,688 in 2024. That is one of the sharpest rises in the country in a year when several expensive departments fell back.

Why the centre attracts capital

Florida is dairy country. The Cuenca Lechera, the milk basin linking San José, Florida and Colonia, is Uruguay's most productive dairy region. Cropping and cattle rotate alongside it, a use mix that spreads price risk across several markets.

The second factor is logistics. Montevideo, the port and the processing plants are a little over two hours away, without paying the premium attached to coastal proximity.

The scale on offer

With 116 contracts across 15,882 hectares, the mean parcel is 137 hectares. That is roughly where a standalone operation begins in Uruguay: large enough to be a viable unit, small enough that the market produces such properties regularly.

Sources

Figures verified on 2026-07-27

Information is provided for information purposes only and does not constitute investment, legal or tax advice. Prices shown are averages from official statistics, not valuations of individual properties.

The series for this department

Prices actually paid per hectare, area traded and the number of contracts of sale, year by year.

  • Since2000
  • Peak5,265 2025
  • Low404 2002
Florida: Prices actually paid per hectare, area traded and the number of contracts of sale, year by year.
YearUSD/haChangeHectares tradedContracts
200054915,45788
2001439−20 %28,255145
2002404−8 %19,318114
2003407+0.7 %35,536147
2004592+45.5 %29,909182
2005785+32.6 %30,698181
2006996+26.9 %47,165212
20071,559+56.5 %43,765144
20082,897+85.8 %33,792174
20092,794−3.6 %14,76771
20102,535−9.3 %21,162132
20113,456+36.3 %20,967143
20123,569+3.3 %14,842121
20134,311+20.8 %20,173119
20143,869−10.3 %7,84669
20153,960+2.4 %9,06160
20163,908−1.3 %5,87353
20173,872−0.9 %20,59380
20183,313−14.4 %11,28664
20193,354+1.2 %11,40566
20203,030−9.7 %8,30370
20213,868+27.7 %14,06892
20224,172+7.9 %24,447108
20234,102−1.7 %11,781102
20244,688+14.3 %13,158105
20255,265+12.3 %15,882116

Source: DIEA / MGAP, "Precio de la Tierra" series. Change against the previous year, computed from the same figures. Reconciled on 2026-07-27

The market report

Ten pages: what land costs in each of the 18 departments, what leasing yields, what a purchase adds on top, and the rules under which a foreigner may buy at all. Every figure with a source and a verification date.

  • Prices for all 18 departments, from registered contracts of sale
  • Gross yield from the official lease and price series, unvarnished
  • Transaction costs with rates, and what they come to on an average parcel
  • The ceilings in Canada and Argentina, with the statutes behind them

You receive the report immediately as a PDF. We also write when DIEA publishes new figures, normally twice a year. No advertising, never sold on, unsubscribe in every message.

Assess properties in this region

We benchmark every property against the most recently published comparable transactions in the same zone before any price is discussed.

Schedule a consultation

Other regions